Note:
ACT - Finance- Investments (Section 1 to 5.3.4.2)
Please Read Before Providing Comments
Thank you for taking the time to review the ACT Finance Investments methodology.
Instructions: Reviewing the ACT Finance Methodology
If you want to provide comments – click on the new comment button located on the right side.

You will be asked to register by clicking on the yellow register button.

If you are already registered on ScribeHub, please sign in (top right corner) before accessing the document and commenting.

Registering
If you are not already registered to ScribeHub, you will be asked to register on the platform - providing your email address, name and creating a password. You will then be sent a confirmation email. Click on the Confirm my account link in the email and you will be redirected to the login screen for ScribeHub. Enter you email and password and you will then have access to the document.
Please note that your name and email address will be used by the ACT team to record the list of people providing comments during this public consultation. Remember the email and password you use to register as this information will always be required to log in to ScribeHub.
Commenting
Once on ScribeHub, please use the comment button

beside each section header to input your feedback. Pressing on the + sign will open a dialog box where you can input the title of your comment, the related section of the document, and your comment. Keep in mind that comments are publicly visible. You can also reply directly to a comment already posted.
The methodology will be proofread before publication, so no need to flag minor editing issues.
Timeline
Please provide your feedback by February 10, 2023
Contact
If you encounter any problems at all with the ScribeHub platform please contact Patrick Hardy.
You can also download the ACT Framework from the ACT website for more context.
Thank you!
Thank you once again for providing valuable feedback, we look forward to reviewing it
ACT 4 Finance | Investors
01/2023 – Version 1.1
|
Acknowledgments ADEME warmly thanks: the members of the Technical Working Group for their inputs and feedbacks on the methodology the financial institutions involved in the road-test of the methodology for their contribution to the methodology improvement
|
|---|
|
Technical coordination: Anatole Métais-Grollier with the support of Stanislas Ray |
 |
|---|---|
| ACT co-founders: |
  |
|---|
| supported by: | |
|---|---|
 |
|
Technical assistance provided by: Kim Nguyen-Huu Simon Messenger |
  |
|
|---|---|---|
|
Quality assurance and quality control on development phase provided by : © ADEME 2023. Reproduction of all or part of work without licence of use permission from CDP Worldwide & ADEME is prohibited. |
||
1. Introduction
In 2015, the “Paris Agreement” consolidated under one agreement the urgent necessity for all stakeholders of the global economy to act on climate change to limit global warming to well-below 2°C above pre-industrial levels. In the years since, science and policy have continued to evolve, and it is now understood that warming should be limited to 1.5°C, which is often referred to as “net zero by 2050”.
As such, over the coming decades, the global economy must radically and rapidly transition from a high volume of carbon-intensive activities towards a mix of lower-emissions activities which are holistically aligned with net-zero by 2050 pathways.
The “Assessing low-Carbon Transition” (ACT) initiative measures a company’s alignment with a future low-carbon world. The goal of the initiative is to drive action by companies and encourage businesses to move to a well-below 2°C compatible pathway (striving for 1.5°C) in terms of their climate strategy, business model, investment decisions, operations and GHG emissions management. In the case of financial institutions, the primary focus is on financed emissions (Scope 3, Category 15) in order to reflect a financial institution’s highest impact area.
1.1 WHY IS AN ACT METHODOLOGY REQUIRED FOR THE FINANCE SECTOR?
As providers and facilitators of capital, financial institutions have a key role to play in this transition, both in terms of supporting companies which are transitioning and shifting capital towards climate solutions.
While the emissions of a financial institution’s business operations and value chain have an overall impact in terms of emissions, the most material impact of a financial institution comes from their financed emissions. Over the last decade, methodologies and initiatives have progressively and rapidly evolved to reflect market understanding of financed emissions and support the development of calculation and attribution approaches and relevant metrics. Recent initiatives which have catalysed commitments made by financial institutions include the Glasgow Financial Alliance for Net Zero (GFANZ) and other net zero alliances such as the Net Zero Banking Alliance (NZBA) or the Net Zero Asset Owner Alliance (NZAOA).
A key challenge of the finance sector is defining and assessing what is within the scope of the financial institution’s control and what is “fair” to assess. How does one track the impact of strategic decisions made by the financial institutions on their clients, customers or assets? How does one measure multiannual progress in view of portfolio turnover? How does one compare, for example, the impact of climate-positive stewardship over a decade with a high-carbon client and a decision to reduce financing to a carbon-intensive sector?
The approach taken by the ACT 4 Finance methodology reflects general approaches taken by the finance sector to date, which focus on a combination of sector-specific and institution-wide strategies and targets regarding main activities of financial institutions. Open-source methodologies, initiatives and approaches, such as SBTI-Fi, PACTA, PCAF and the frameworks of the GFANZ, NZBA, NZAOA, NZAMI, IIGCC were leveraged in the development of this assessment framework.
The methodology will basically try to capture/assess the following elements:
- The credibility and robustness of the financial institution’s transition plan
- The impact of the financial institution in terms of contribution to bring down GHG emissions in the real economy (1).
(1) 2DII. https://2degrees-investing.org/wp-content/uploads/2021/04/Climate-Impact-Mgmt-System.pdf.
‘“Impact” […] designates a causal, demonstrable relationship between a financial institution’s action and a real-world change – in the case of climate change, a change in GHG emissions.’
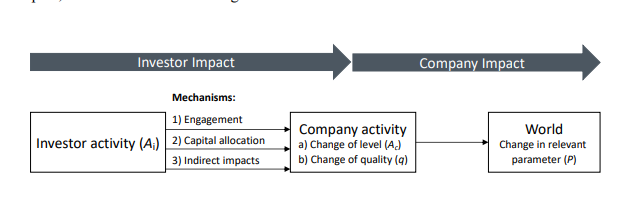
Figure 1: Key Concept and Mechanisms (2)
(2) Julian F. Kölbel, Florian Heeb, Falko Paetzold and Timo Busch. Can Sustainable Investing Save the World?
iii. Its contribution to financing a low carbon economy (e.g. climate solutions financing)
Due to the abovementioned specific challenges related to the financial sector, the methodology cannot cover/cover in the same way all activities performed by financial institutions that can be relevant from a low-carbon transition standpoint. It has been chosen to split the methodology into two sub-methodologies representing two main activities of the sector: banking and investing activities. Some other activities (trading, brokerage, insurance coverage) have been disregarded due to complexity, lack of expertise, data or methodology at the time. Further works may be contemplated in the future to enhance this framework.
2. Principles
The selection of principles to be used for the methodology development and implementation is explained in the general Framework. Table 1 recaps the adopted principles that were adhered to when developing the methodology.
| Relevance - Select the most relevant information (core business and stakeholders) to assess low-carbon transition. |
| Verifiability - The data required for the assessment shall be verified or verifiable. |
| Conservativeness - Whenever the use of assumptions is required, the assumption shall be on the side of achieving a 2° maximum global warming. |
| Consistency - Whenever time series data is used, it should be comparable over time. |
| Long-term orientation - Enables the evaluation of the long-term performance of a financial institution while simultaneously providing insights into short- and medium-term outcomes in alignment with the long-term. |
3. Scope
3.1 Scope of the document
This document presents the ACT assessment methodology for investing activities. It includes the rationales, definitions, indicators, and guidance for the sector-specific aspects of performance, narrative and trend scorings, and is split out for Investment activities.
It was developed in compliance with the ACT Guidelines for the development of sector methodologies which describe the governance and process of this development, as well as the required content for such documents.
It is intended to be used in conjunction with the ACT Framework, which describes the aspects of the methodology that are not sector specific.
3.2 Scope of the sector
This section on the scope specifies which type of Financial Institution this methodology can assess.
The ACT 4 Finance Investing methodology aims at assessing financial institution on an international level. The methodology should be used to assess financial institution with the following NACE or ISIC codes:
| Perimeter | NACE Rev. 2 (3) | ISIC Rev. 4 |
|---|---|---|
|
Trusts, funds and similar financial entities Insurance Fund management activities |
64.30 65.11 65.12 66.30 |
6430 6511 6512 6630 |
(3) Eurostat.https://ec.europa.eu/eurostat/documents/3859598/5902521/KS-RA-07-015-EN.PDF.
To be more explicit, the Investing methodology aims to assess the following actors:
- Asset Managers (including private equity or debt investors)
- Asset Owners (insurance company, pension funds, public entity)
The ACT 4 Finance – Investing methodology includes the following asset classes:
- Equity (Listed and Private)
- Debt (Listed and Private)
- Real estate (REITS)
- Project financing
Factors that were considered for the inclusion of these asset classes (4):
- Level of risk
- Size of GHG emissions of the asset class
- Size of the market
- Relevance for the financing of invested companies
- Ability to influence
- Timeframe of the investment
- Size of revenue of the financial institution
FIGURE 1: BOUNDARIES OF THE ACT 4 FINANCE – INVESTING METHODOLOGY
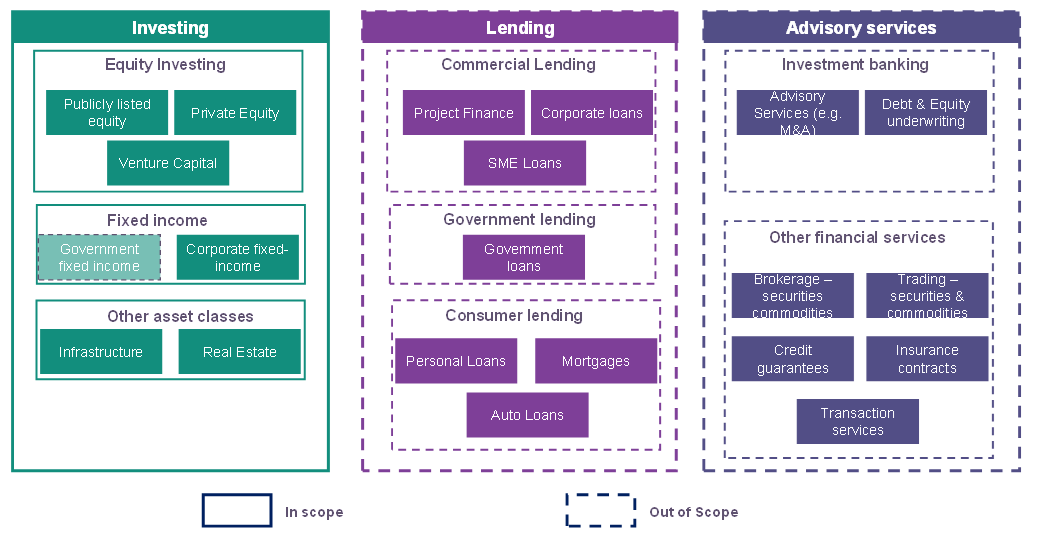
Source: Adapted from GHG Protocol, Guidance for the financial sector: Scope 3 accounting and reporting of greenhouse gas emissions - 2013 (5)
(5) Industry, PCAF - PCAF launches the 2nd version of the Global GHG Accounting and Reporting Standard for the Financial.
Where a financial institution has both lending and investing activities, assessors should conduct two different assessments. One from the ACT 4 Finance Lending methodology and one from the ACT 4 Investing methodology. Our next work regarding the methodology is notably to find robust methodological choices making it possible to aggregate the two scores in a global one.
RATIONALE FOR SCOPE DEFINITION
Asset Class:
The ACT 4 Finance Investing methodology includes the asset class mentioned above for various reasons (please also refer to the factors π mentioned above):
- Methodologies available to date to compute financed emissions
- Maturity of current carbon accounting market practice on these asset class and data availability
- Mechanisms of impact possible
The ACT 4 Finance investing methodology excludes the following types of asset class:
- Sovereign Bonds: no methodology has been available when developing the methodology in 2022. It will be integrated in the future methodological updates, depending on our position on the new PCAF standard on measuring sovereign debt (5), as it can represent a substantial part of some asset managers/owners’ portfolio composition.
- Commodities: whereas such asset class could embed interesting issues in itself (for instance investing in rare metals or coal) this asset class hadn’t been taken into account due to the complexity of the topic and lack of standards vs. the actual size of the investments made by most company in this sector compared to others.
- Derivatives: Can have direct influence on a company but highly volatile. To be included later on (2024) (7)
- Any other asset class which does not fall under the scope of the following one: listed & private equity, listed & private debt, project finance, real estate.
Investors typology;
Investors are quite active in the commitments made to align portfolios to net zero and mobilize large amounts of money for contributing to finance the transition to a low carbon economy.
Still, there is an important distinction to do among investors as their impact levers and role in the transition are not same.
Primary Market
Likewise banks, some investors are operating on the primary markets, participating directly in the financing of a project or a company. Impact levers are more clear and directly impactful through the money they will invest in.
For primary markets investors, financial flows directly finance companies and/or project. As so, to be impactful in terms of GHG emission reduction in the real economy, the investment must be (i) oriented towards climate solutions, the net-zero transition of firms, the managed phaseout of high-emitting assets, and firms already aligned to net-zero (6).
Second lever, (ii) direct engagement notably through voting rights, idealistically with investor alliances/groups.
This type of investors is fully relevant for the ACT 4 Finance investing methodology assessment.
Secondary market
Investors on the secondary market do not directly finance companies and project. It supports the stock or market price of the instrument it holds. Impact on the company’s activities is more indirect though impact levers still exist:
-Reallocate/reweight companies in their portfolio construction. Impact: price signal (‘Signaling that impact matter’ (1)). Evidence of impact of this action is difficult to find for single actions. It can work if a substantial portion of the market adopt the same position.
-Engagement/Vote. Can directly impact the company’s decarbonization strategy (demanding transition plan, publication of science-based objectives etc..) when successful resolutions/votes (i.e. most of the time when vote has been led by collective actions) and, as a result, GHG emissions reduction in the real economy.
Not all type of investors operating on the secondary market are relevant for the ACT 4 Finance investing methodology. As a matter of fact, some investors have a holding period that is not relevant with an impact or contribution approach.
Some investors combine activities on the primary and the secondary market. This ACT 4 Finance investing methodology takes this into account through different weighting depending on the investor profile (see section 6.).
Besides this distinction, the ACT 4 Finance Investing methodology has integrated another distinction between asset managers and asset owners.
Asset Managers vs Asset Owners
Generally speaking, most asset owners mandate asset managers to manage the money they are responsible for.
Asset managers manage and invest the money, with different approaches (asset class, geography, active or passive management (or mix)), the primary (private equity/debt) or secondary market.
Still, some asset owners have both activities: they directly invest and mandate part of their activities.
This tool takes these elements into account as well. (see section 6.2)
4. Boundaries
→ NOTA BENE
Hereafter, the term “emissions” will refer to all GHG emissions (not only CO2), which shall be measured in CO2 equivalent.
ACT provides guidelines concerning the scope and boundaries of the sectors covered by this methodology to determine which types of GHG emissions are included or excluded. However, it does not provide tools and databases to measure and compute these emissions. In particular, the choice of emission factors does not fall under the responsibility of the ACT methodology. The methodology will not require the use of specific emission factors. However, emission factors should be consistent with emission factors and GWP’s used to compute the reference emissions pathways and benchmark scenarios for the quantitative indicators in order to be relevant.
4.1 Reporting Boundaries
For any financial institutions, scope 3 related to ‘investments’ (category 15) are included. This means, we include financed emissions in the boundary. That will include also relevant scope 1, 2 and 3 (where significant) for financed companies’ emissions. The data reported shall be gross emissions to be comparable with the IEA benchmarks.
RATIONALE FOR BOUNDARY SETTINGS
Downstream activities of investors – investments – are significant GHG emitting activities and over 700 times greater than they own emissions (scope 1 & scope 2) (7) . Other source mentions that the vast majority (95%-97% (NZAOA (8))) of an asset owner’s emissions come from its portfolio emissions for instance. This major source of GHG emissions is called ‘financed emissions’. As mentioned by PCAF, financed emissions are a necessary input for climate scenario analysis. In this methodology, financed emissions are an important metric for the target module.
(8). FI, UNEP. NZAOA Target Setting Protocol Second Edition
5. Construction of the data infrastructure
5.1 Data sources
In order to carry out a financial institution level assessment, many data points need to be gathered which can be sourced from various sources. Principally, ACT relies on the voluntary provision of data by participating financial institutions. These data points can be; amounts of financing, financed emissions intensities, stress testing framework etc. Next to this however, external data sources (like Asset Resolution, Rystadt, Wood Mckenzie, etc.) might be consulted where this would streamline the process, ensure fairness, and provide additional value for verification and validation. In addition to data collection from financial institutions, the World Benchmarking Alliance (WBA) is using publicly available information to generate benchmarks of ACT assessed financial institution (based on their own methodology). The CDP questionnaire is also recommended. The FI sector includes all sub-categories within Financial services from the CDP Activity Classification System (CDP-ACS). This includes Asset Managers, Banks, Insurance and Real Estate Investment Trusts.
5.2 Financial institution Data request
The data request will be presented to financial institution in a comprehensive data collection format. The following data will be requested:
| Data requested to the financial institution |
| Global investing amounts: total assets under management (whether directly hold or delegated) (in monetary terms; e.g. € or $), by sectors idem), or asset class (idem) |
| Investments flow orientation: Use of proceeds vs General Corporate Purpose financial amounts/assets under management (past 3 years) by sectors or asset class (in monetary terms, e.g., € or $) |
| Financed GHG emissions: global (absolute), by sectors (absolute or physical intensity) or asset class (absolute or physical intensity) |
| Reduction targets (absolute and intensity) |
| Transition Finance Guide/Framework / Taxonomy used |
| Exit policy regarding fossil fuels & coal |
| Climate solutions financing |
| Environmental policy and details regarding governance |
| Management incentives |
| Scenario testing framework |
| Engagement strategy & Framework |
| Investees engagement policy |
| List of initiatives implemented to influence investors/investees |
| Financial institution policy on engagement with trade associations |
| Position of the financial institution on significant climate policies (public statements, etc.) |
| Financial amount of low carbon or transitional activities/climate solutions or entities financed |
| Tools & policies facilitating channeling credits to the transition towards a low carbon economy |
5.3 Performance indicators
The performance indicators have been conceived following the main principles described in Table 2.
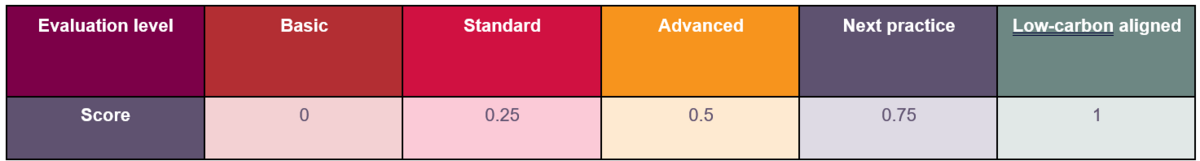
For qualitative scoring, maturity matrices will be used. A maturity matrix contains five levels of evaluation that are associated with scores given to the financial institution for each indicator. Depending on the indicator, it might be possible to obtain only part of the score. Some indicators might be divided into sub-dimensions that are evaluated individually before the score is aggregated to obtain the indicator score.
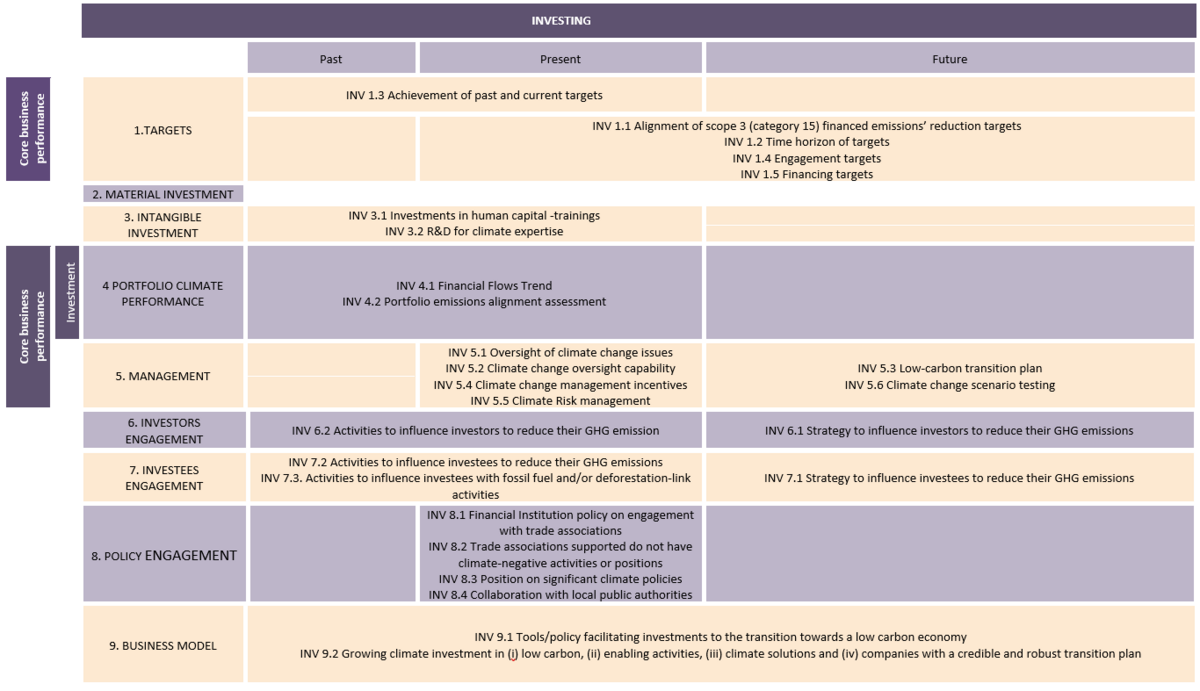
5.3.1 Module 1: Targets
This module focuses on assessing whether the financial institution has targets on (i) reducing its financed emissions (1.1, 1.2, 1.3) and (ii) financing reduced emissions (1.4, 1.5).
5.3.1.1. INV 1.1 Alignment of scope 3 (Category 15) emissions reduction targets
| Description & Requirements | INV 1.1 Alignment of scope 3 (category 15) emissions reduction targets | ||||||||||||||||||||||||||||||||||||||||||||||||||||||||||||||||||||||||
|---|---|---|---|---|---|---|---|---|---|---|---|---|---|---|---|---|---|---|---|---|---|---|---|---|---|---|---|---|---|---|---|---|---|---|---|---|---|---|---|---|---|---|---|---|---|---|---|---|---|---|---|---|---|---|---|---|---|---|---|---|---|---|---|---|---|---|---|---|---|---|---|---|---|
| Short description of indicator | A measure of the alignment of the financial institution scope 3 (category 15) sectoral emissions reduction targets with sectoral related low-carbon benchmark pathways. The indicator will compare the trend of sectoral financed emissions targeted pathway to the trend of sectoral related benchmark and identify the gap between both pathways at the target year, which is expressed as the financial institution’s commitment gap. Where only global portfolio or non-sectoral asset class targets exist, the trend will be compared to a reference absolute contraction scenario. | ||||||||||||||||||||||||||||||||||||||||||||||||||||||||||||||||||||||||
| Data requirements |
The relevant data for this indicator are:
CDP Questionnaire mapping to this indicator:
External sources of data used for the analysis of this indicator are:
Benchmarks to be updated with an IEA NZE benchmark where possible by March 2023 (before road-testing). This table and the associated tool will be updated. Table 3 Sector, Asset Class and General Target types | Benchmark involved
The sectors above have been chosen in this methodology as they are considered as the most emissive one and, as a result, are covered by the ACT sectoral methodologies. It goes beyond the coverage recommendation of the NZAOA and PAII NZIF in terms of sector coverage as the ACT initiative has been producing expertise on all the most emissive sectors. To understand the journey from calculating financed emissions to setting Science Based targets, please refer to the following standard
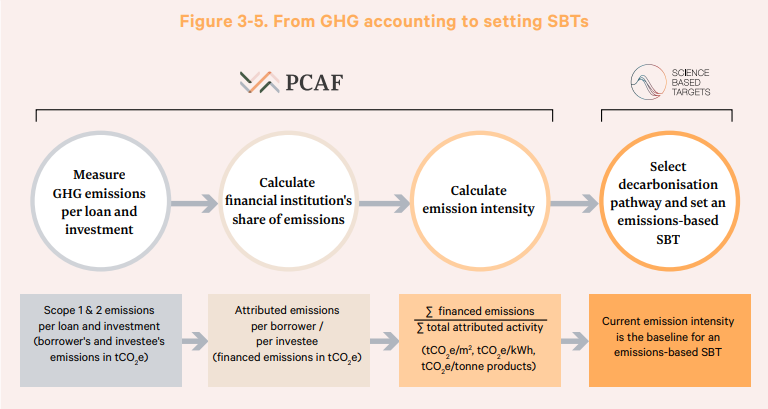 Figure 1: PCAF: From GHG accounting to setting SBTs Financed emissions are the key information to enable the commitment gap assessment and thus the 1.1 sub indicator scoring. Still, two typed of financed emissions can be used here:
|
||||||||||||||||||||||||||||||||||||||||||||||||||||||||||||||||||||||||
| How the assessment will be done |
The analysis is based on the difference between the financial institution financed emissions’ (physical or absolute) target and the associated benchmark (sectoral (SDA) or general (ACA)) at the target year. It is done on every target, let it be sectoral target, asset class target or global portfolio target and aggregated into a final score applying weightings on the type of targets (sectoral targets are emphasized as it can really help to pilot the business areas transition). We will focus here on sectoral intensity targets, but the same method applies for absolute targets. The sectoral target pathway is the decarbonization over time, defined by the financial institution scope 3.15 sectoral financed emissions reduction target. To compute it, a straight line has been drawn between the starting point of the analysis and the financed emissions target endpoint. The financial institution’s sectoral pathway selection will depend on the sectoral target (e.g., Electric Utilities). See section 6.1 for details on the computation of this pathway. The indicator compares TE (Target Emissions) to FISB (Financial Institution Sectoral Benchmark) at the target year (YT), by assessing the difference between these pathways. The pathways are expressed in the sector related intensity metric. The result of the comparison is the commitment gap. To assign a score to this indicator, the size of the commitment gap shall be compared to the maximum commitment gap, which is defined by the business-as-usual pathway (BAU). BAU is defined as an unchanging (horizontal) intensity pathway, whereby the emissions intensity is not reduced at all from the reporting year.
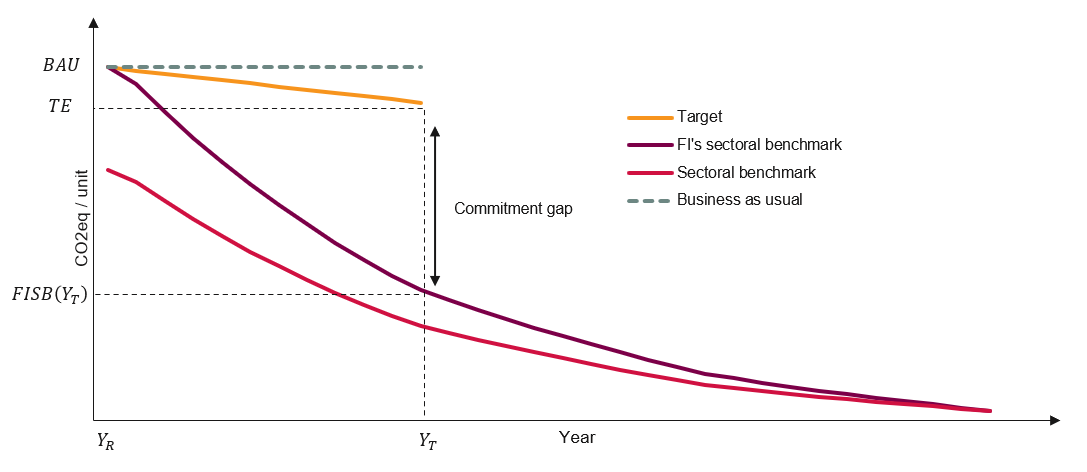 Figure 2: Trend ratio and commitment gap For the global portfolio target, the absolute financed emissions will be considered and compared to a benchmark aligned with 1.5°C scenario with no or low overshot, using an ACA approach. For asset class targets, we have two options depending on the way the institution has set targets:
Calculation of score: First a trend ratio is calculated to deduct a commitment score which is then weighted according to relevant dimensions (data quality, credit coverage, GHG coverage, sectorial adjustment) to give the final score. Trend ratio The trend ratio is calculated by dividing the financial institution’s commitment gap by the maximum commitment gap: 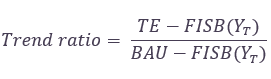
Commitment score The financial institution sectoral target achieves the maximum score if the sectoral financed emissions' target pathway is aligned to or more ambitious than the financial institution’s sectoral benchmark (commitment gap <= 0). It achieves the minimum score if the sectoral financed emissions’ target pathway is less ambitious than the business-as-usual pathway (commitment gap >= maximum commitment gap). In between, the commitment score is inversely proportional to the commitment gap. The score is calculated as follows: Table 4: Commitment score conditions 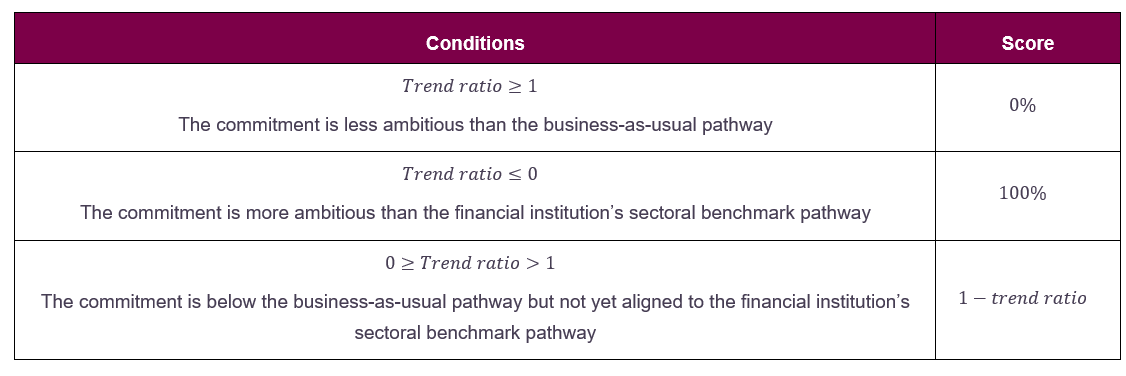
Final Score The final score assigned to the indicator is weighted by different factors: Final score = commitment score * AuM coverage score * GHG coverage score * sectoral adjustment * data quality score (i) AuM coverage score The Asset under Management (AuM) coverage score takes into account the possibility that a financial institution sets reduction targets not taking into account all its portfolio. As a matter of fact, this possibility is specified by the Financial sector science-based targets guidance of the SBT. A minimum level of coverage in term of monetary value of the portfolio must be covered3. Some parts of the portfolio can be excluded by the financial institution in the target boundary for various reasons: desire to focus on most significant emitters or on a dedicated sub-sector, difficulty to access the data on a part of the perimeter. These minimum requirements (see table 5) have been integrated in the methodology and associated tool. The AuM coverage represents the share of the assets under management, in monetary terms, covered by the target. For example, a financial institution has a 10bn€ asset portfolio on sector A. It has set a target that excludes exposures to a small specific sub-sector that is deemed too complex to handle due to lack of data/methodologies. At the reporting date, the exposure to this sub-sector represents 100m€ so 1% of the global portfolio of the institution on the sector A. Therefore, the AuM coverage of the sector A is 100%-1%=99%. The AuM coverage score is obtained by comparing the AuM coverage to a minimum threshold that should be met. As abovementioned, those thresholds come from the SBTi framework. 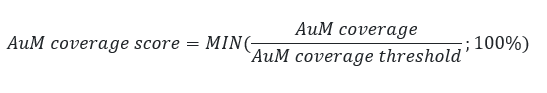 With the AuM coverage thresholds defined as follows: Table 5: Credit coverage threshold coming from SBTi: 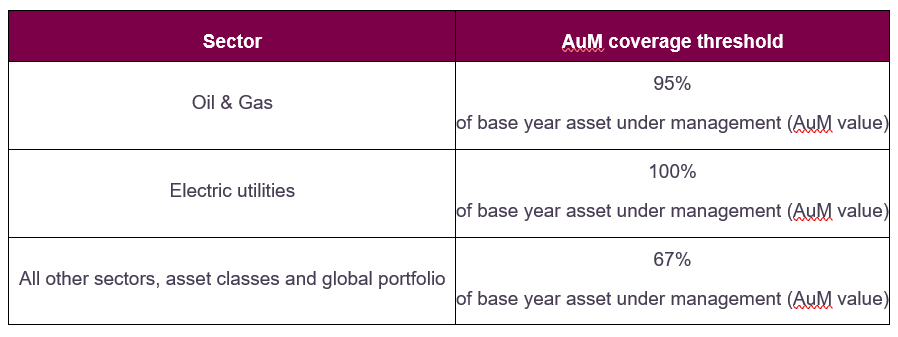
(ii) GHG coverage score The GHG coverage score takes into account the possibility that a financial institution set emissions reduction targets without taking into account all sources of emissions. As a matter of fact, data, methodologies and complexity do not make it always possible to measure 100% of the GHG financed emissions associated to a given asset. For instance, where a financial institution set a target where it intends to reduce by 50% its financed emissions of a given sector B, it can exclude some part of the sectoral value chain and emissions. Assuming it would represent 20% of the total GHG emissions, the GHG coverage would be of 100%-20%=80%. The methodology acknowledges that collecting GHG data is a challenge for some sectors and part of the sectoral value chain. Therefore, instead of weighting the score directly by the GHG coverage, it is weighted by a GHG coverage score associated to different level of coverage as follows: Table 6: GHG coverage score array 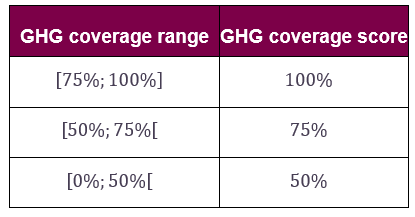 In our example, the GHG coverage score of sector B would be of 100%. (iii) Sectoral adjustment: As sectors have a different contribution to the global emissions of GHG, it has not the same importance to set target on a primary energy sector (e.g. Oil&Gas) than on an end use one (e.g. Pulp&Paper). Contribution of each sector to the global scoring will therefore be corrected in order to take into account these differences. Therefore, a specific parameter is calculated as follows: 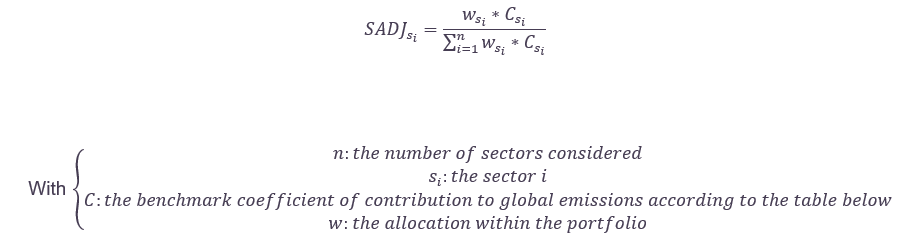 And with the benchmark coefficient of contributions defined as: Table 7: coefficient of Contribution of sectors and asset classes to global emissions 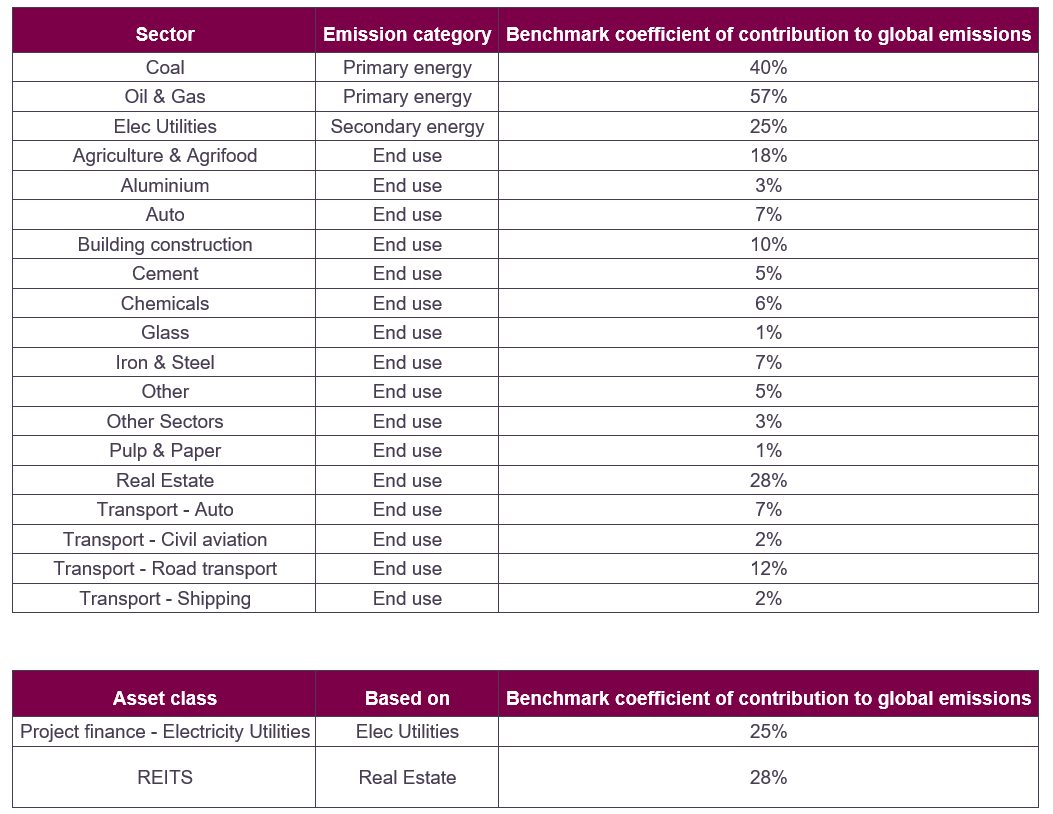
These parameters are based on the public source “ourworldindata” (12). They aim at representing the influence of each sector based on the world global emission of GHG. The reason for having a >100% sum is that sectors are inter-connected and looked at a different level of the energy value chain. For example, O&G is a primary energy, and its emissions will embed some secondary energy emissions and end-use emissions. This reflects the accountability of investing in the O&G sector as we can’t deny responsibility on what it will be used for: if a financial institution finances an oil extraction platform, not only it would have participated to the platform’s emissions but also to make available oil barrels that would be use for transportation and chemicals for example. The responsibility embeds the whole value chain. (12) Alliance, World Benchmarking. https://www.worldbenchmarkingalliance.org/climate-and-energy-benchmark/. There is an exception for the global portfolio where SADJ = 100%. (iv) Data quality score The data quality score is based on the confidence attributed to the GHG data. The confidence level follows the PCAF data quality scoring system and ranges from 1 (certain data) to 5 (uncertain data).
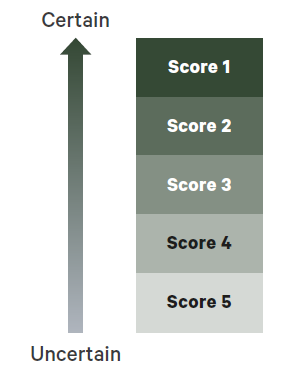 Figure 3: PCAF DATA QUALITY SCORE We support the extensive description of levels that PCAF defines for each asset class. See below the example for listed equity and corporate bonds and for others it can be referred to their official standard (13). (13) 100+, Climate Action. https://www.climateaction100.org/net-zero-company-benchmark/. 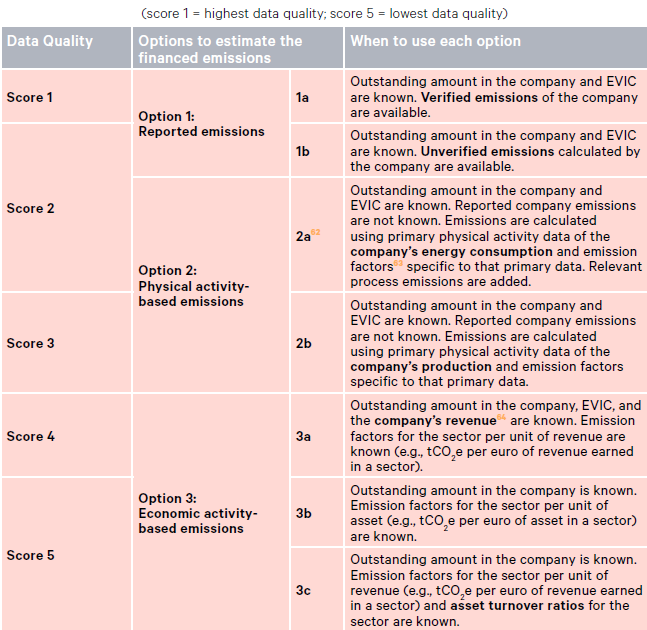 Figure 4: PCAF GENERAL DESCRIPTION OF THE DATA QUALITY SCORE TABLE FOR LISTED EQUITY AND CORPORATE BONDS For asset classes not falling into PCAF’s scope, the following interpretation is used: Table 8: Confidence level’s description 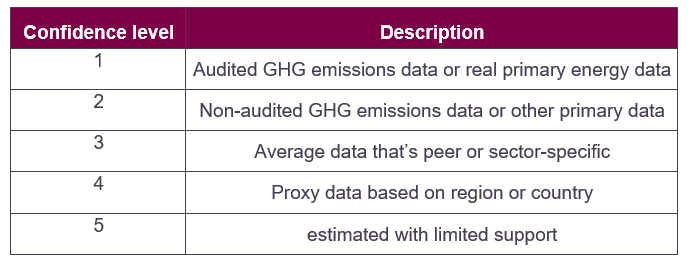 The confidence level is then converted into a percentage data quality score which reaches a maximum of 100% for a confidence level of 1 and a minimum of 20% for a confidence level of 5. 
Aggregated score The aggregated score depends on the structure of the targets set by the institution. As financial institutions are investing in various high emitting sectors, sector related targets should ideally be set. Therefore, it has been chosen to provide less weight for targets set in a less ambitious way. The consolidation of the scores assigned to each target is the sum of the commitment gap given the fact that each commitment gap is already adjusted by (i) AuM coverage score, (ii) GHG owned emissions, (iii) sector contribution, and (iv) data quality score. 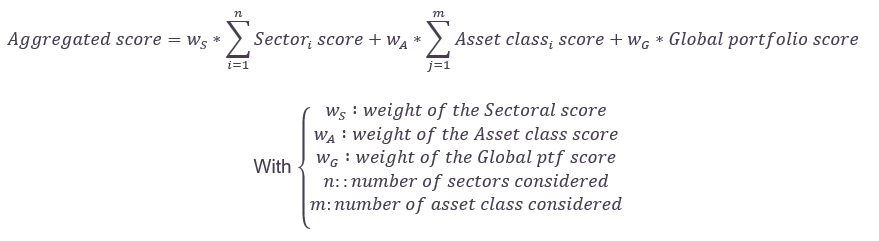 And the weights being defined depending on the combination of targets. Table 9: Score’s weightings depending on granularity of targets 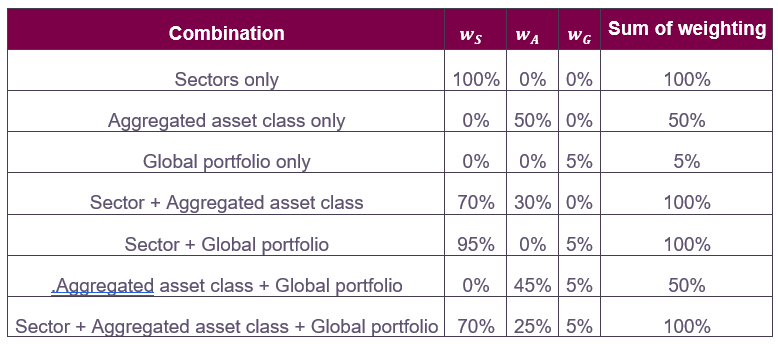 “Aggregated asset class” stands for the case of non-sectoral target setting approach. This mean the targets for the financial institution are tied to absolute CO2e emissions reduction and at the asset class level. For instance: ‘Financial institution A has set a reduction target of 30% on its corporate bond asset class, from a 2021 base year and with a target date of 2030’. Where asset class targets are based on a sector (likewise in the SBTi Financial Sector Science Based Targets Guidance (August 2022): ‘Financial Institution B commits to reduce GHG emissions from the steel sector within its corporate lending portfolio X% per ton of cement by 2030 from a 2018 base year’) then it falls under the ‘Sectors only’ category of the table above. Important difference is that asset classes referring to a sector will have associated decarbonization pathway using (excepted for Chemicals and Agri & Agro sectors) an SDA approach (when relevant), and for aggregated asset classes it will automatically be using an ACA 4.2% annual reduction. |
||||||||||||||||||||||||||||||||||||||||||||||||||||||||||||||||||||||||
| Rationale | INV 1.1 Alignment of scope 3 (category 15) emissions reduction targets | ||||||||||||||||||||||||||||||||||||||||||||||||||||||||||||||||||||||||
| Rationale of the indicator |
Relevance of the indicator: Alignment of inclusive scope 3.15 emissions reduction targets are included in this ACT methodology for the following reasons:
Scoring rationale: Targets are quantitatively interpreted and directly compared to a low-carbon benchmark build from the current level of sectoral financed emissions at reporting year and converging toward the 2050 value of the sectoral benchmark relevant for this source. Comparing the trends gives a direct measure of the commitment gap of the financial institution sectoral targets. It was chosen for its relative simplicity in interpretation and powerful message. Financial institutions’ portfolio being heterogeneous, there is no existing benchmark for this industry. The approach followed in this methodology allows to score separately each individual target and aggregate their score. The emphasis is on sectoral targets as they can be directly related to the decarbonisation efforts needed by sectors. NB: In previous ACT methodologies, the calculation was based on the difference between the company’s target and the company benchmark 5 years after the reporting year. The analysis is now based on the difference between the financial institution’s target and the financial institution’s benchmark at the target year. The previous version assumed that the emission reduction would be linear between reporting year and reporting year + 5, which could affect the result as the low-carbon pathway is not linear, the new version avoids this assumption by using directly data at target year. |
5.3.1.2 INV 1.2 Targets time horizon
| Description & Requirements | INV 1.2 Targets time horizon |
|---|---|
| Short description of indicator | A measure of the time horizons of financial institution targets. The ideal set of targets is forward looking enough to a long-time horizon compatible with sectoral productive assets’ lifetime and capex plan, but also includes short-term targets that incentivise action in the present. |
| Data requirements |
The relevant data for this indicator are:
CDP Questionnaire mapping to this indicator:
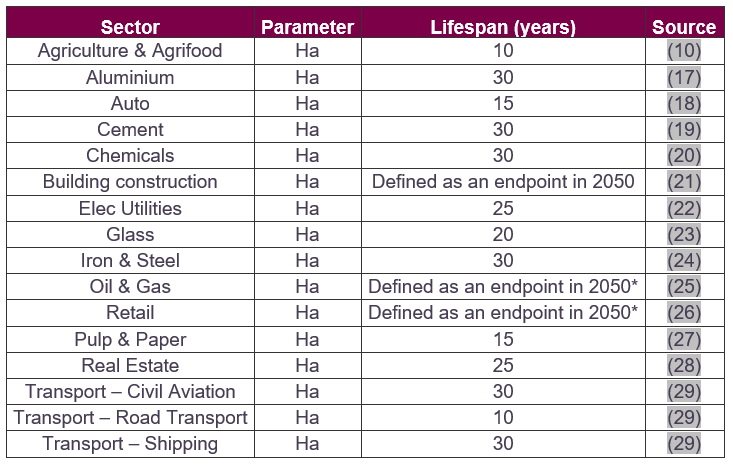
Another important proxy defined in this methodology is the sector’s lifespan to which target horizons will be compared to. It represents the average lifespan of the sector’s underlying productive assets. The reason for choosing the underlying productive assets’ lifespan is to match the investment directly to what it supports rather than to the investment duration. Indeed, financial institutions should be accountable for the whole lifespan of the underlying productive asset they invest in. Furthermore, while a financial institution is financing the construction of a new factory with a 5 year-loan does not stop it from emitting afterwards. Therefore, reduction targets should be in line with the lifespan of what it finances in order to efficiently manage its financed emissions and its asset to finance selection. From another perspective, if the financial institution continues renewing its financing to the same company operating the same productive asset it has helped to finance in the first place, the induced emissions can’t reduce until it is renewed or replaced at the end of its lifespan. That’s why target time horizon should be in line with the reality of the real economy. The sector’s lifespan parameter has been provided using already existing underlying ACT methodologies on each relevant sector, see table below. .
*For the Oil & Gas sector, the ACT O&G methodology has been considering 2050 as an endpoint because ‘Setting 2050 as the horizon is consistent with a low carbon scenario timeline and with the fact that the average lifetime of upstream portfolio assets is usually more than 30 years’ (25) (25) SBTi. Value Change in the Value Chain: Best practices in scope 3 greenhouse gas management. 2017 + Assuming that the lifetime of a building is around 50 years, the target endpoint is compared to the long-term point (LT), which is fixed at 2050 minus the reporting year, aligned with 2°C scenario. Table 11: Other 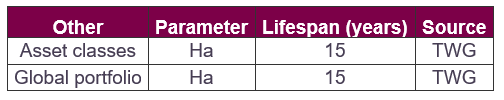 A default lifespan of 15 years for asset classes and the global portfolio. |
| How the assessment will be done |
The analysis has two dimensions, each weighted at 50%:
To ease the understanding, the explanation will follow the example of a financial institution’s sectoral target, but the methodology applies to asset class and global portfolio target too. DIMENSION 1 – TARGET ENDPOINT: The sectoral target endpoint (𝑇𝑒) is compared to the sector productive asset lifespan 𝐻𝑎 (for instance 30 years). The sectoral target endpoint (𝑇𝑒) is equal to the longest time horizon among the same sectoral targets, minus the reporting year: 𝑇𝑒=𝐿𝑜𝑛𝑔𝑒𝑠𝑡 𝑡𝑎𝑟𝑔𝑒𝑡 𝑡𝑖𝑚𝑒 ℎ𝑜𝑟𝑖𝑧𝑜𝑛−𝑟𝑒𝑝𝑜𝑟𝑡𝑖𝑛𝑔 𝑦𝑒𝑎𝑟 The analysis compares the financial institution’s target endpoint(𝑇𝑒) to 𝐻𝑎. This analysis measures the horizon gap: 𝐻𝑜𝑟𝑖𝑧𝑜𝑛 𝑔𝑎𝑝=𝐻𝑎−𝑇𝑒 The financial institution’s target endpoint is compared to 𝐻𝑎. A maximum score of 50% is attained if 𝑇𝑒 equals or exceed 𝐻𝑎, in which case the horizon gap is zero. A zero score is awarded if the horizon gap is too high, meaning greater than 2/3 of 𝐻𝑎 or otherwise stated, that the sectorial target endpoint Te is smaller than the third of the sector productive asset lifespan (for instance if the sector productive asset lifespan is of 30 years and the sectorial target endpoint is no more than 10 years). Eventually an intermediate percentage score is awarded for any target that is between these two points, proportional to the size of horizon gap. Table 11: Target endpoint’s score conditions 
DIMENSION 2 – INTERMEDIATE HORIZONS: Each sectoral targets and their endpoints are calculated and plotted. The ideal scoring sector that provides a maximum 50% score does not have intervals between target endpoints larger than 5 years from the reporting year. Measurements are done in five-year intervals between the reporting year and 𝑇𝑒. The sectoral targets are compared according to the following scoring table: Table 12: intermediate horizon scoring conditions  An example is illustrated in Figure 5 (below).
 Figure 5: EXAMPLES OF INTERMEDIATE TARGETS Horizons SET FOR THE SECTOR AND CORRESPONDING SCORES ON DIMENSION 2 OF THE INDICATOR 1.2
FOR ALL CALCULATIONS: If the financial institution enters the sentence ‘a target year has been set’ in the data request cell, then the calculations may be redone using this as the baseline instead of the reporting year. The financial institution’s sectoral target can attain up to 80% of the maximum score with this alternative calculation. The baseline that results in the higher score will be used for the final score. Note: When several targets are assessed, the aggregation of the scores will be a weighted average of the target scores, based on the share of emissions covered by the targets, the credit coverage, the data quality score, the sectoral contribution. Calculation of score: For each sectoral target the final time horizon score is defined as follows: Final score = (dimension 1+dimension 2) * AuM coverage score * GHG coverage score * sectoral adjustment * data quality score And the aggregated score for the financial institution:  With credit coverage score, GHG coverage score, sectoral adjustment, data quality score, wS, wA, wG being the same as parameters defined in the 1.1 indicator calculation. |
| Rationale | INV 1.2 Targets time horizon |
| Rationale of the indicator |
Relevance of the indicator: The time horizon of targets is included in the methodology for the following reasons:
Scoring rationale: The score of this indicator is tied to how the target timeline compares to the lifetime of the sectoral productive assets (which are directly or indirectly benefitting from the financial institution’s investment). The financial institution has a ‘horizon gap’ if its targets do not go up to this lifetime. |
5.3.1.3 INV 1.3 Achievement of past and current targets
| Description & Requirements | INV 1.3 Achievement of past and current targets | |
|---|---|---|
| Short description of indicator | A measure of the financial institution’s historic target achievements and current progress towards active emission reduction targets. The ambition of the target is qualitatively assessed and is not included in this performance indicator. Though, it is quantitatively assessed in the performance indicator 1.1. | |
| Data requirements |
The relevant data for this indicator are: For each target set in the past 10 years:
CDP Questionnaire mapping to this indicator:
|
|
| How the assessment will be done |
For the performance score, this indicator is assessed on two dimensions, whereby financial institutions achieve the maximum score if: Dimension 1: The financial institution has achieved all previous emissions reduction targets with a target year in the past 10 years. If all past targets are indeed achieved, the highest score is obtained. If not, the achievement ratio a is computed as follows: 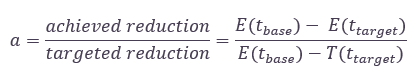 where
A threshold is set for scoring at 50%: if the financial institution has achieved less than 50% of its own past target, it shall receive a zero score. If the financial institution has several past targets over the last 10 years, the ratio a shall be computed for each target. 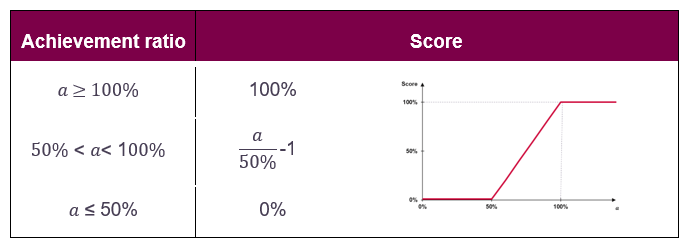 The score is then weighted by the different factors as defined in 1.1: Dimension 1 = score * credit coverage score * GHG coverage * sectoral adjustment * data quality score
Dimension 2: The financial institution is currently on track to meet an existing emissions reduction target. The assessment is based on the progress ratio p: 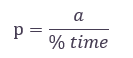
a being defined in dimension 1 and the past time ratio %time defined as follows:  Where
The highest score is attained if p ≥ 1. A percentage score is assigned for any value between 0 and 1. 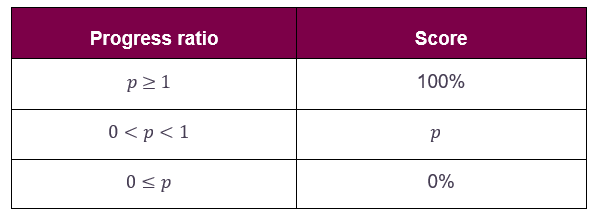 The score is then weighted by the different factors as defined in 1.1: Dimension 2 = score * AuM coverage score * GHG coverage score * sectoral adjustment * data quality score For this second dimension, target year must be at least one year after reporting year, and target start year must be at least one year before reporting year. Final score: As the maturity between financial institutions and companies target setting is higher for companies (the topic is more recent for financial institutions but it is no surprise as emissive sector target setting methodology needed to be achieved), the two dimensions will be considered differently over time. The topic being more recent for financial institutions almost no financial institutions have already set targets in the past that we can assess. However, the different decarbonization initiatives (e.g., NZBA, SBTi) recommend reporting the first result in 2025 the latest. In order to take this into account, the 1.3 score is calculated differently depending on the assessment year. Assessment year before 2025 (included) As the financial institution might not have past set targets, dimension 1 will only be considered if it improves the score. Current targets are also more considered compared to past targets as they are still ongoing. Final score = MAX(25% * dimension 1 + 75% * dimension 2; dimension 2 Assessment year after 2025 (excluded) After 2025, as financial institutions are expected to have delivered their first results, they must have had past set targets. Therefore, dimension 1 will always be considered. Current targets are also more considered compared to past targets as they are targets that can still be managed. Final score = 25% * dimension 1 + 75% * dimension 2
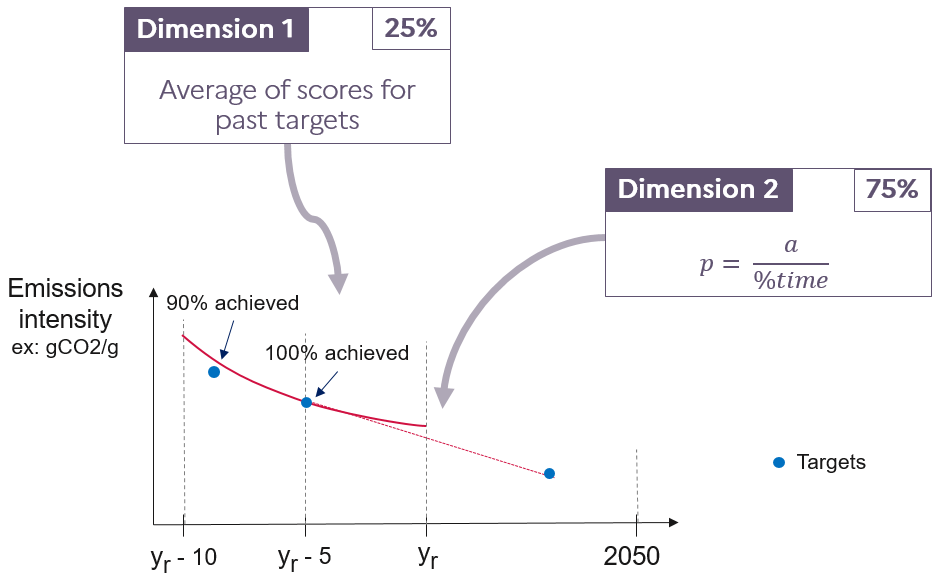 Figure 6: CALCULATION OF PREVIOUS TARGET ACHEIVEMENT INDICATOR Aggregate score The score is calculated for the global portfolio, asset class and sectoral targets and aggregated depending on the combination of target types chosen by the financial institution. 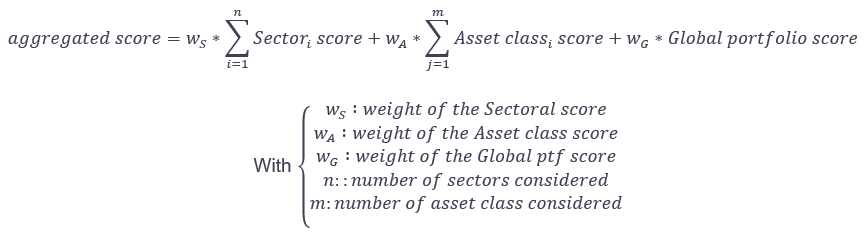
With wS, wA, wG being the same as parameters defined in the 1.1 indicator calculation. For all calculations: The performance score does not assess the ambition level of previous targets, and therefore dimension 1 has only a low weight in the final performance score. This information is also qualitatively assessed in the narrative analysis, which will take another look at the following dimensions:
|
|
| Rationale | INV 1.3 Achievement of past and current targets | |
| Rationale of the indicator |
Relevance of the indicator: Beyond the ambition and the suitability of a decarbonation target, handled by indicators 1.1 and 1.2, it is important to assess its credibility. To that extent, the most robust way to do so is to look at the institution’s track record: an institution that has met its previous commitments and that is well on track for its future ones should be rewarded, compared to another one. Scoring rationale:
|
|


5.3.1.4 INV 1.4 Engagement targets
| Description & Requirements | INV 1.4 Engagement targets |
|---|---|
| Short description of indicator | The Financial institution retirement commitments on the Coal, Oil & Gas & deforestation sectors. It eventually analyses the portfolio coverage ambition regarding the % of companies with a credible and robust transition plan (see glossary). This indicator helps for a comprehensive target-setting approach as it completes the pure GHG emission related targets. |
| Data requirements |
Data for this indicator are:
Suggestion of external sources:
CDP Questionnaire mapping to this indicator:
|
| How the assessment will be done |
The analyst will determine if the fossil fuels phasing out & deforestation strategies are ambitious enough meaning that investing activities will not contribute to unlock projects that are not compatible with keeping global warming below 1.5°C (e.g. new credit lines to oil & gas production). As so, this indicator will assess the coal, oil & gas and deforestation commitments/policies adopted by investors. For Coal and Oil & Gas sectors, will be assessed:
For the Oil & Gas sectors further elements have been integrated on the unconventional fossil fuels sectors such as Artic, Fracking, Tar Sands and Ultra Deep Water. Several conditions have to be met, similar to what has been mentioned above: threshold criteria (revenues, production), timeline, new project expansion and financing exclusion. Eventually, the analyst will assess the financial institution capacity to push borrowers and clients adopt robust & credible transition plan. The following Coal and Oil & Gas matrices are based on the work made by Reclaim Finance in the Oil & Gas Policy Tracker and Coal policy tool The matrix is provided below: Coal: 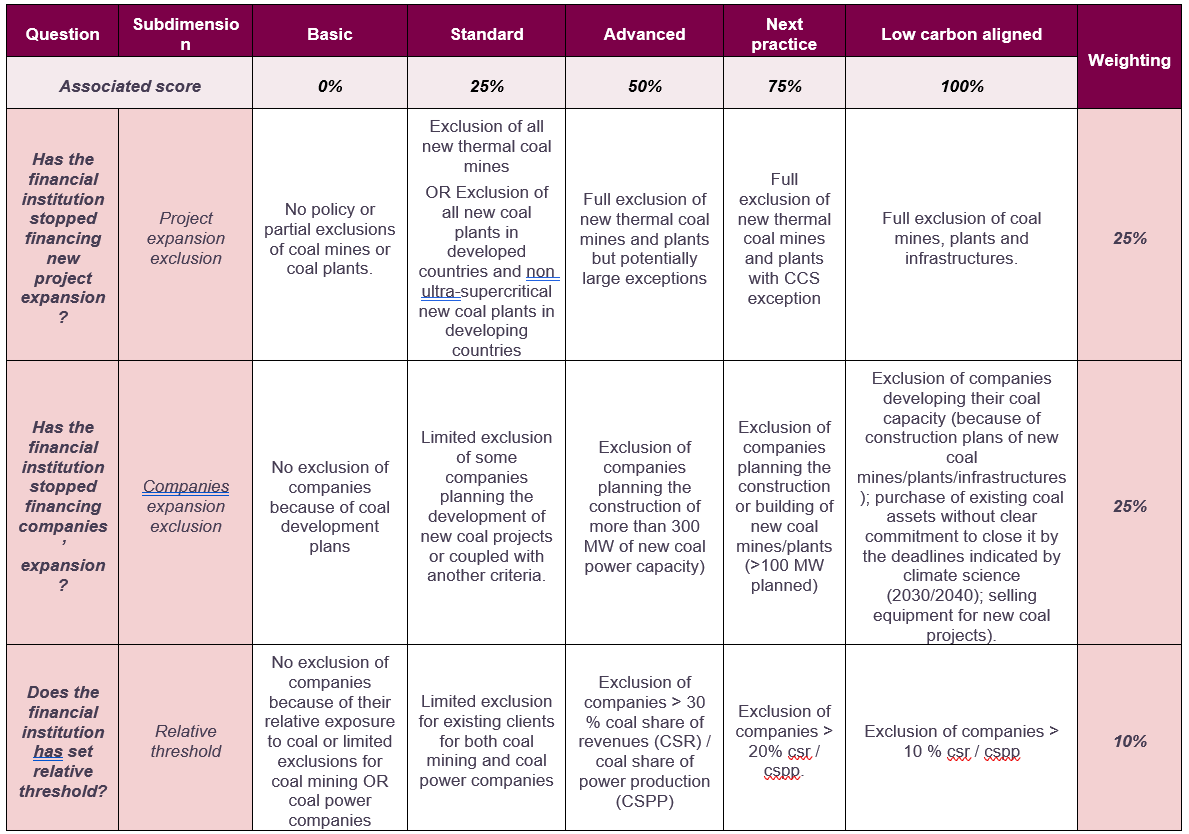   *Meaning: if the financial institution scores 50% in the Exclusion, scope & consistency, then the final 1.4 Coal score will be downgraded by 50% Oil & Gas:   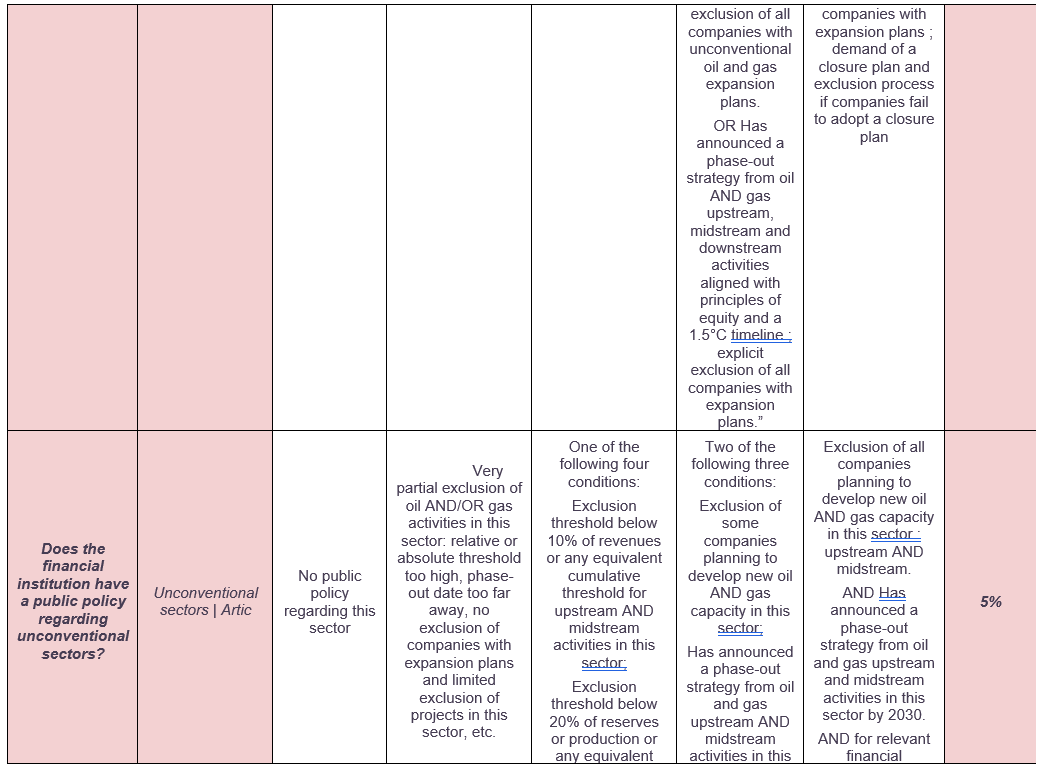 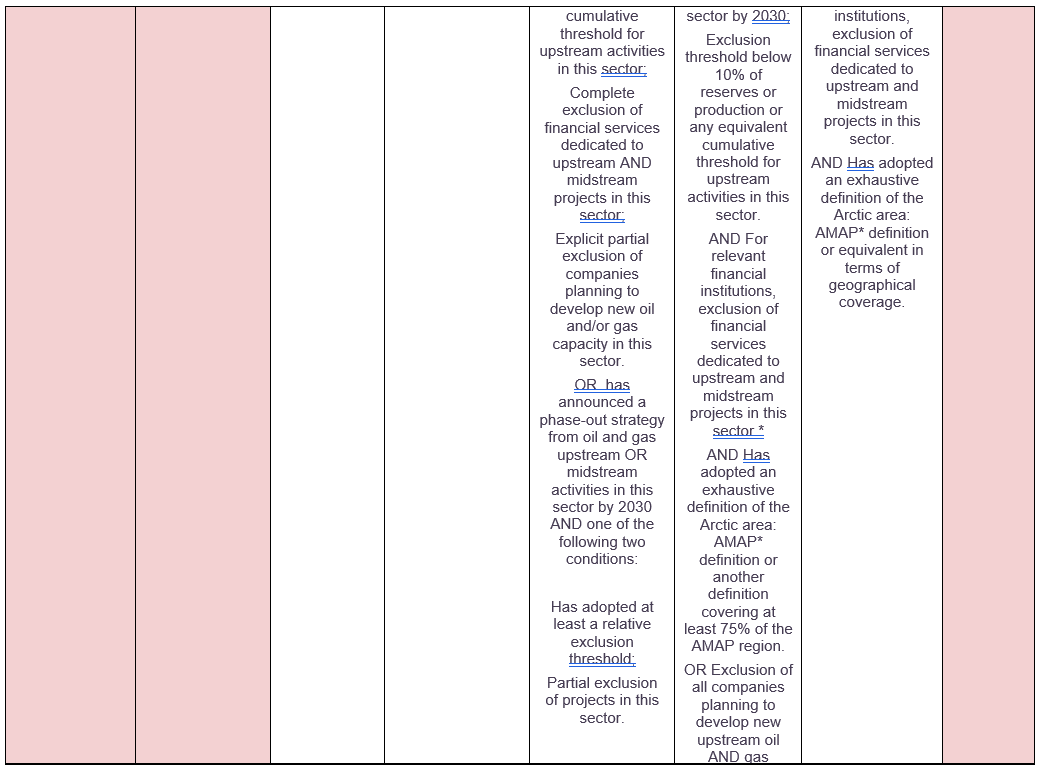 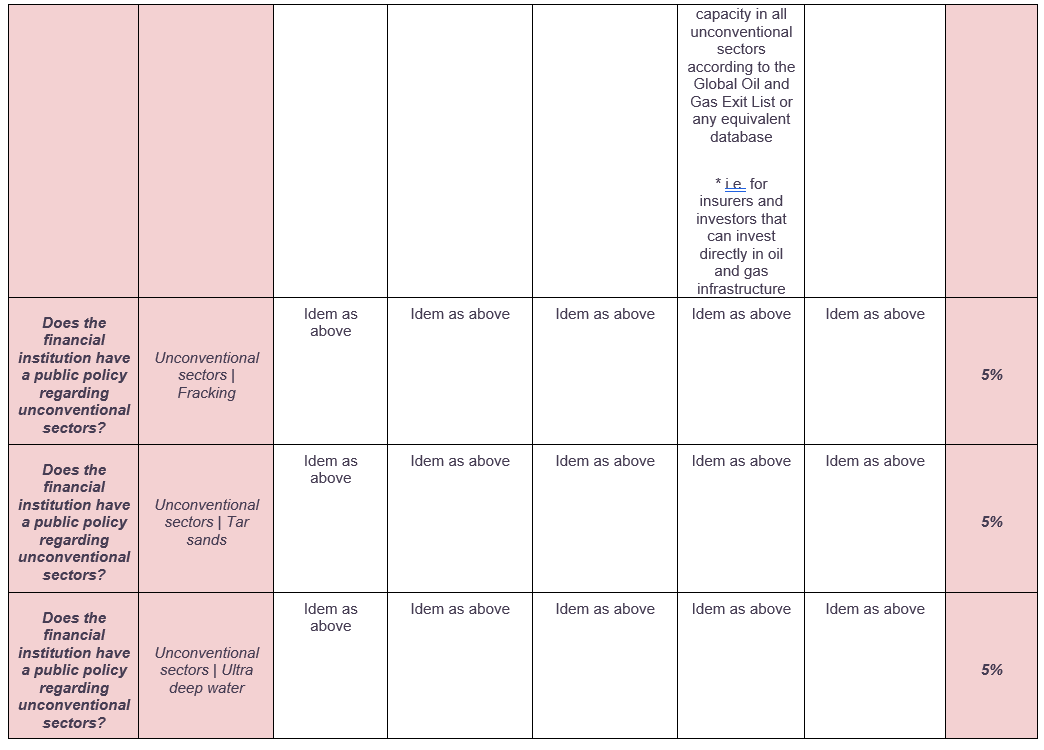 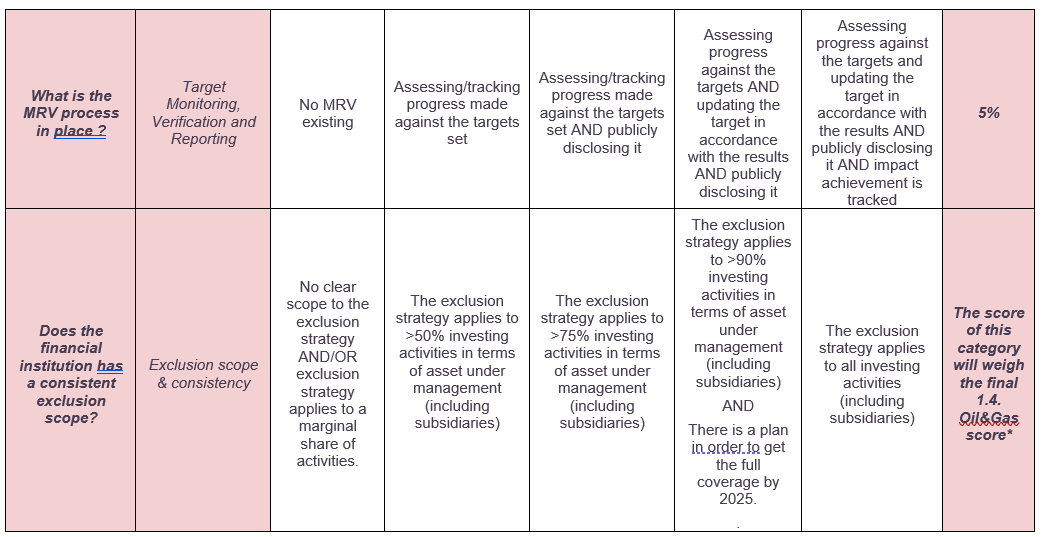 *Meaning: if the financial institution scores 50% in the Exclusion, scope & consistency, then the final 1.4 Oil & Gas score will be downgraded by 50% Deforestation related activities:
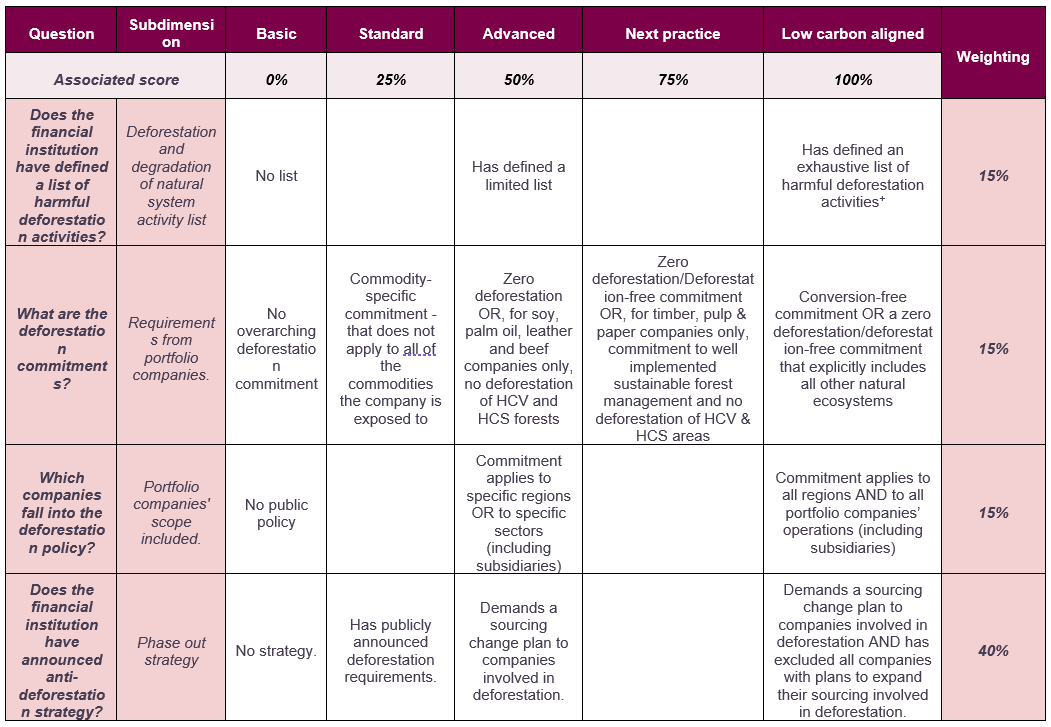 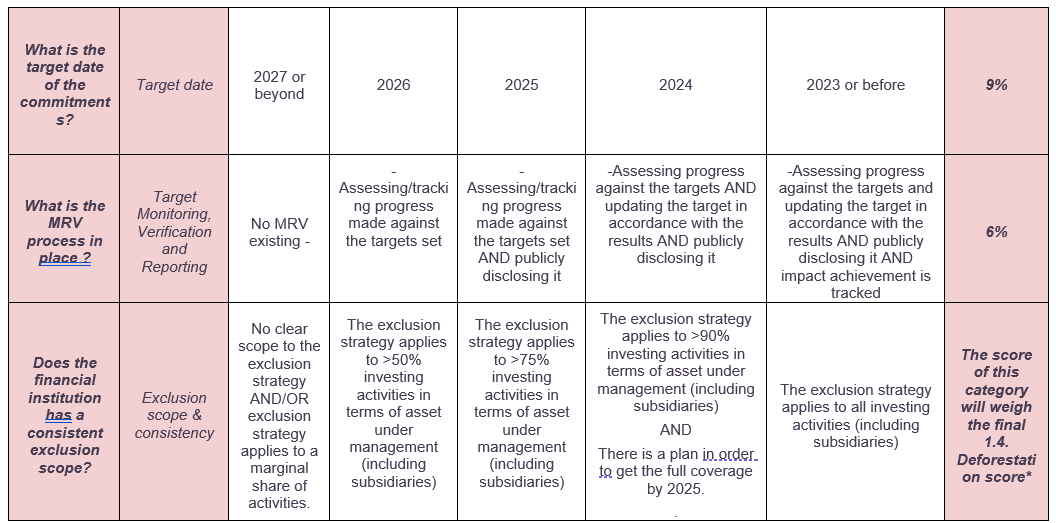 *Meaning: if the financial institution scores 50% in the Exclusion, scope & consistency, then the final 1.5 deforestation score will be downgraded by 50% + Sources: GFANZ and https://forestsandfinance.org Asset Managers and Asset Owners portfolio coverage target engagement 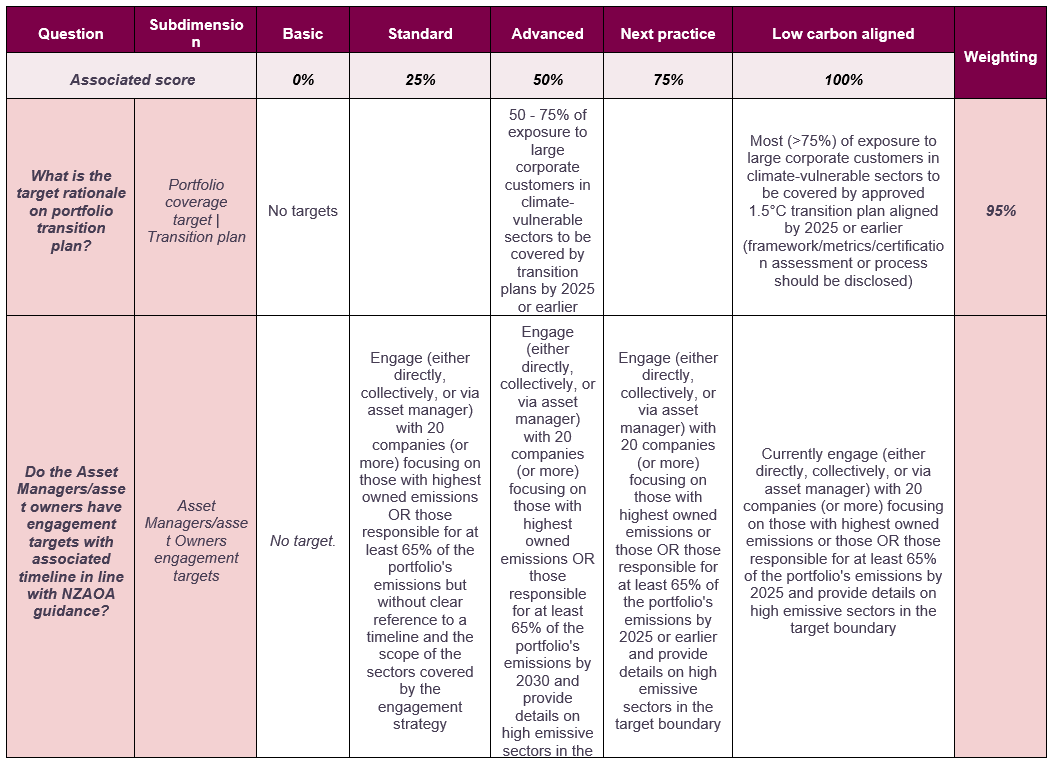 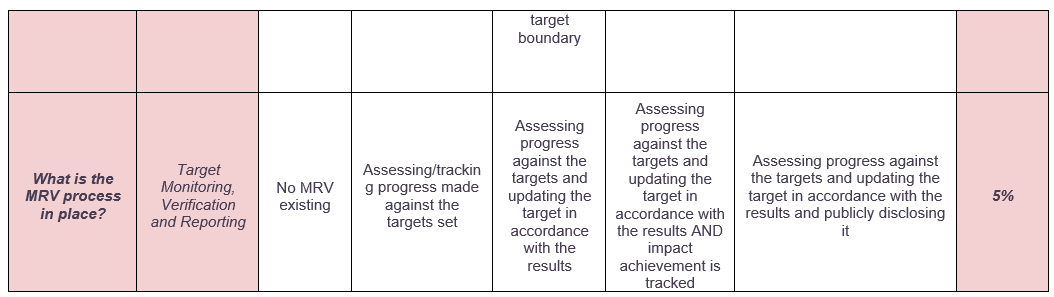 *Meaning: if the financial institution scores 50% in the Exclusion, scope & consistency, then the final 1.4 Portfolio transition plan coverage score will be downgraded by 50% |
| Rationale | INV 1.4 Engagement targets |
| Rationale of the indicator |
Relevance of the indicator: The sole GHG emission target setting is not sufficient to capture the impact of a financial institution. The issue with GHG emissions related targets, for a financial institution, is that it only focuses on the portfolio emissions. Setting GHG emission reduction target at portfolio level (sectoral or by asset class) is only tied to the financed emissions. Problem is that reducing portfolio emissions does not mean reducing GHG emissions in the real economy. ‘‘Investor impact [is] the change that investor activities achieve in company impact’ (Kolbel et al, 2019) through various mechanisms (engagement, capital allocation, indirect impacts), as opposed to the impact of the companies in the portfolio. It is consistent with previous research (Brest et al, 2018) and the IFCs definition.’’ (2DII) Other definition can be found through the ISO14097 as ‘FIs climate contribution accounts for the effects caused by their climate actions and is expressed in GhG emissions units i.e. in the real economy’. (PACTA, RMI) Engagement is known to be one of the most impactful mechanisms for Financial Institutions Climate impact. As so, assessing the commitments associated with Fossil Fuel sectors, deforestation activities and companies with a transition plan appears to be key. Relevance of the Coal and Oil & Gas Sub-indicators: Fossil fuel combustion is the principal source of anthropogenic GHG emissions worldwide and an impactful sector to drive the transition. As testified by the Net Zero 2050 roadmap There is no need for investment in new fossil fuel supply in our net zero pathway. More explicitly stated:
 https://www.iea.org/reports/net-zero-by-2050 Relevance of the deforestation sub-indicator: Financings towards Deforestation, as a main source of carbon storage destruction (and of biodiversity, but it is not in the scope of the methodology) has to be stopped. Combining a phasing out strategy on both fossil fuels sectors & deforestation appears to be an impactful assessment mix. Relevance of the portfolio coverage sub-indicator: The portfolio coverage target setting is an interesting non GHG based target (GHG emissions reduction targets have been assessed in 1.1). This approach completes the GHG based approach as it aims to assess the objective of the number of companies with a credible and robust transition plan by a defined timeline. It is clearly inspired from the SBTi Portfolio coverage approach but the metric associated here is not the number of companies with a science based target but the number of companies with a transition plan (more ambitious as science based target is only one key aspect of a transition plan). Scoring rationale:  |
Basically, stopping financing Coal and Oil & Gas is the first direct and tangible step for a financial institution to prevent enabling projects that are putting discredit on the possibility to reach Net Zero. This is why it should have more importance in the scoring.
Deforestation is also a critical topic but the focus we wanted to put light on is on fossil fuels.
Portfolio transition plan is an interesting metric to measure when we talk about non GHG target setting for financial institutions and pushing credible and robust transition plan adoption by companies.
5.3.1.5 INV 1.5 Financing targets
| Description & Requirements | INV 1.5 Financing targets |
|---|---|
| Short description of indicator | This indicator assesses the financial institution’s roadmap on climate solutions financing. |
| Data requirements |
Relevant and external sources of data used for the assessment of this indicator: Climate Financing roadmap
CDP Questionnaire mapping to this indicator:
|
| How the assessment will be done |
Analysing the climate financing roadmap of the financial institution. The analyst will have to assess the description of the related strategy and the evidence of approved strategy and budget for climate solution roadmap over the next decade and further. The matrix is provided below: Climate solution financing targets:     * Meaning: if the financial institution scores 50% in the Exclusion, scope & consistency, then the final 1.5 deforestation score will be downgraded by 50% + The following list of 7 criteria will help to assess each climate solutions related metric. If several metrics exist, then the score is the average of the individual average score. These 7 criteria are based on the IIGCC report on Climate Transition (11), who has built upon the criteria used by the Portfolio alignment team.
|
| Rationale | INV 1.5 Financing targets |
| Rationale of the indicator |
Relevance of the indicator: There are major financing gaps in climate solutions technologies, whether it be enabling, transitional or aligned. Financing climate solutions is essential both for the global transition and for the financial institution impact by financing positive impact activities. There is a high need for scaling up green finance. Many times, it is publicly communicated in vague way like: ‘we will finance more than 100BN in sustainable finance by 2025’. Here again, the goal is to assess the commitments made and its ambition on financing climate solutions and managing a new financing roadmap, in terms of technologies, geography (amount and types of technologies needed differ from one area to another) and timeline. |
5.3.3 Module 3: Intangible investment
5.3.3.1 INV 3.1 Investments in human capital – training
| Description & Requirements | INV 3.1 Investments in Human Capital |
| Short Description of the indicator | Assessment of the employees and board training levels on climate related issues. |
| Data Requirement |
Relevant and external sources of data used for the assessment of this indicator:
Board members trained |
| How the Assessment will be done |
Dimensions assessed: The share of employees receiving a climate-related specific training The share of training costs relative to climate-related trainings Some examples of climate related trainings are given in the following list:
The analyst will seek evidence of an ambitious climate training strategy, in order to assess both climate training quality and ambition (e.g. development & upskilling programs for the different business lines of the financial institution). The ratio will be compared to the maturity matrix developed to guide the scoring and a greater number of points will be allocated for financial institutions indicating a higher level of maturity. The matrix is provided below:  
Level 1
Level 2
Level 3
Level 4
|
| Rationale | INV 3.1 INVESTMENTS IN HUMAN CAPITAL – TRAINING |
| Rationale of the Indicator |
Relevance of the indicator: Investments in human capital are included in the ACT 4 Finance assessment for the following reasons:
|
5.3.3.2 INV 3.2 R&D for climate expertise
| Description & Requirements | INV 3.1 R&D for Climate Expertise |
| Short Description of the indicator | A measure of the ratio of R&D budget dedicated to climate expertise. The indicator will identify the ratio between the financial institution’s R&D budget out of the total spent on the past three years. |
| Data Requirement |
Relevant and external sources of data used for the assessment of this indicator:
Total R&D budget dedicated to climate topics, tools, studies, expertise |
| How the Assessment will be done |
Example of activities to include in the R&D budget for climate expertise:
Salary expense of FTE dedicated to climate works can be included in the numerator ratio (i.e. R&D climate budget).
Scope exclusion:
|
| Rationale | INV 3.2 R&D for Climate Expertise |
| Rationale of the Indicator |
Relevance of the indicator: The R&D budget for climate expertise is included as it is key for a financial institution to upskill its climate capabilities and integrate and adopt climate related tools enabling notably to address the ACT modules of this methodology (e.g. target setting, taxonomic share, portfolio alignment, impact measurement, financed & facilitated emissions computation). scoring rationale: The final score will be the one given to the highest ratio on the past three years. The financial institution should not be penalized if it has not a high ratio level on a specific year as these R&D investments depends on specific/cyclical needs. |
5.3.4 Module 4: Portfolio Climate performance
5.3.4.1 INV 4.1 Financial Flows trend
| Description & Requirements | INV 4.1 Financial Flows trend |
|---|---|
| Short description of indicator | An analysis of the financial institution’s contribution to financing the transition of the real economy through the perspective of its past and current investments. This is a contribution-focused indicator, meaning that it does not look at the evolution of the financed emissions at a portfolio level, but the orientation/breakdown of the financings towards (i) taxonomic activities and (ii) companies with a credible and robust transition plan. |
| Data requirements |
The relevant data for this indicator are:
CDP Questionnaire mapping to this indicator:
|
| How the assessment will be done |
It is a quantitative indicator that will assess the contribution share evolution in the past three years from reporting year in two categories:
Please find hereafter a definition of the concepts used in this module:
ACT methodologies provide key elements about the credibility of the transition plan on the 14 most emitting sectors (14). Please also refer to the work of EFRAG in the ESRS E1:
 Figure 7: Exposure Draft ESRS E1 Two aspects will be considered in this, the ‘flow’ and the ‘stock’ approach:
The ‘flow’ consideration will be only applied to the fossil fuel sector. Indeed, scientific reports are very clear on that, to limit global warming to 1.5°C with no or low overshoot, there can’t be any expansion or exploration projects financed and fossil fuel use should decrease as quick as possible. As so, new financings in this sector should only be towards taxonomic-compliant activities or companies with a robust and credible transition plan. For other sectors, there is no clear benchmark on financings needs and orientation with enough granularity to compare new financings to. Therefore, only the total exposure (the ‘stock’ consideration) will be assessed, as it should overall increase its transition financing share. Introduction to a common formula: First, there is an important key formula to be explained as it will be widely used in this module. The trajectory alignment score (TAS) The Trajectory Alignment Score (TAS) is made of 2 dimensions, reflecting:
The Trajectory Alignment Score will apply a different weight to PS and TS depending on the PS. The Perf Score (PS) 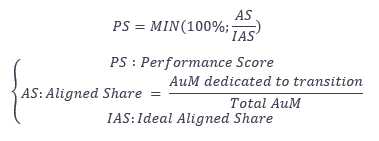 The PS is the share of AuM actually allocated to transition, Aligned Share (AS), in relation to the share that should ideally be allocated, Ideal Aligned Share (IAS). The IAS is defined as the best possible proportion of AuM allocated to transition that should be ideally reached at a defined “ideal year”. By definition, the PS cannot exceed 100%. See table 13 and 14 below for the Ideal Aligned Share and its associated ideal year that must be reached, per sector. This associated ideal year is used for the calculation of the Trend Score, see below. It is also declined by instrument type as the calculation will be made on both “use of proceeds” and “general corporate purpose” instrument types. AuM allocated to transition refers to:
For example, if a financial institution investing in equity in the automotive sectors has 30% in a car manufacturer producing vehicles respecting the EU Taxonomy technical criteria, 45% in a car manufacturer that has not reached those criteria but has elaborated a credible and robust transition plan to reach it and 25% in a car manufacturer that doesn’t meet the criteria and doesn’t have a transition plan, the aligned share would be 30%+45%=75%. Table 13: Ideal aligned share and the year to reach it for (i) use of proceeds instruments 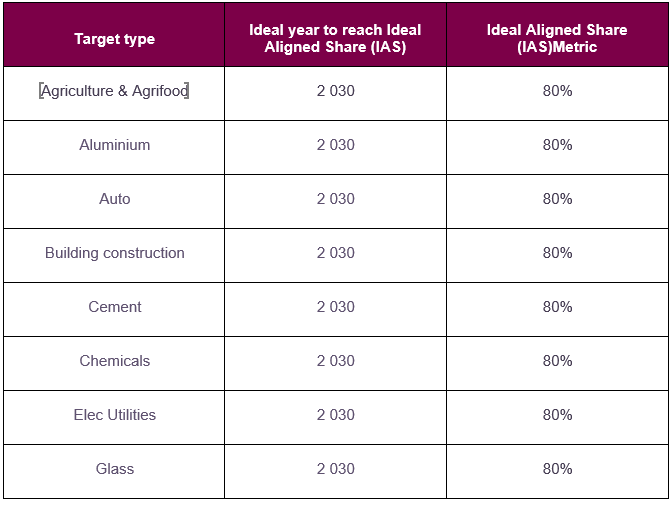  Table 14: Ideal aligned share and the year to reach it for (ii) general corporate instruments   As there is a commonly and widely accepted milestone of 2030 with a target of reducing at least 50% (55% in Europe) of its fair share of emissions (comparing to 1990), the ideal year to reach the ideal aligned share is set as 2030. Indeed, as first key results shall materialise by 2030 it is assumed that all sectors should already be at least on a transition phase. That’s why for general corporate purpose instruments the ideal aligned share is 100%, meaning that companies should at least have a transition plan compatible with a global warming of 1.5°C with no or low overshoot. For use of proceeds instruments, as we acknowledge that the proceeds could be directed towards economic necessities with no climate materiality (e.g., operational expenditures), the ideal aligned share is set to 80%. For oil & gas, as there is a necessity to not burn and extract the remaining allocated fossil fuel carbon budget to keep a 1.5°C warming trajectory and an urgency to act, the ideal year to reach an ideal alignment share is set as 2025. The Trend Score (TS) Assuming the compound annual growth rate CAGR representing the aggregate growth in AuM share allocated to transition  where p is the number of years over which the evolution is considered, e represents AS in reporting year y, and s represents AS in reporting year y-p. The past 3 years’ CAGR is 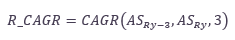 Example: credit share allocated to transition has evolved from 10% to 20% in the last 3 years. Therefore, the credit annual growth rate is nearly 26%. The ideal CAGR corresponds to the ideal growth over the period remaining (i.e., between the current Ry year and the ideal year Iy when the alignment should preferably be finalized and reach IAS). If the aligned share is already higher than the ideal aligned share then I_CAGR=0% as we don’t consider negative growth. 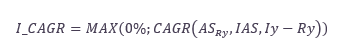 Example: on use of proceeds, as of 2022 8 years remain until 2030 which is the ideal year set for the Auto sector. If the current credit share allocated to transition in 2022 for this sector is of 20%, then as it should reach a level of 80% in 8 years the ideal credit annual growth rate will be of nearly 18,9%. The Trend Score is the ratio between CAGR and I_CAGR. It represents the growth of the AuM share dedicated to the transition already achieved relative to the remaining growth necessary in the optimal timeframe. This value is contained between 0% and 100%. 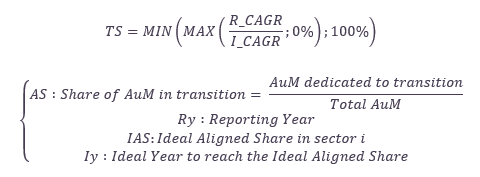 As a result, an investor with a large increase in its AuM dedicated to the transition could still obtain a low trend score if the ideal growth in AuM is very high (i.e. whether the efforts to be provided are very high). Conversely, an institution with a low growth of AuM dedicated to the transition could still have a high trend score if the ideal growth is not very high (i.e., if the institution initially started with a good AuM allocation). The Trajectory Alignment Score (TAS) The TAS is obtained through a weighted combination of the performance and the trend score. The relative weight of each score varies as for a portfolio already well aligned the trend score won’t be as important as for a portfolio that still have a significant gap before reaching the ideal aligned share. Therefore the PS weight fluctuates depending on the level of the PS, with a minimum weight initially set at 50% (and therefore a maximum TS at 50%). However, this level can be further downgraded as it shall be taken into account on specific cases where the aligned share is already above the IAS but with a negative trend. A weighting adjustment has therefore been implemented where PS= 100% (meaning AS>= IAS) but the trend over the past years is descending (R_CAGR<0%). The formulae implemented are: 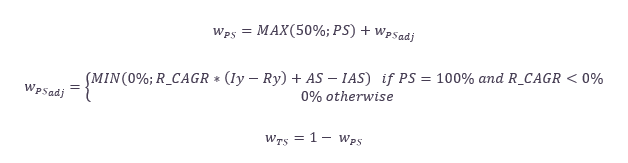
The following example get through the adjustment mechanism. Let’s consider a situation where AS=95%, IAS=80% and where CAGR=-3% with 9 years to reach the ideal target year. PS is therefore of 100% and without the adjustment, the company would get the maximum points while its past trend is not good, which is counter-intuitive. The adjustment reflects the fact that, should the negative past trend continue in the future, the asset share would fall eventually below the IAS. In this example, this would mean that, after 9 years continuing with the same trend (assumed linear in the formula for the sake of simplicity), the AS would go down by -3%*9 years = -27%, hence from 95% to 68%. This means that there would be a -12% gap with the IAS. The application of the adjustment will lower the performance weighting (from 100% pre-adjustment to 88% post-adjustment and complementarily highlight the importance of the trend score from 0% to 12%.  Figure 8: illustration of the trajectory alignment score’s weighting mechanism The trajectory alignment score is thus a weighted combination of the performance score and the transition score: 
Calculation of score: As for the module 1, the score depends on the granularity of the data and will combine a sectoral score, an asset class score, and a global portfolio score, where available. Monitoring its financings at the sector level, compared to portfolio or asset class levels, helps to foster decarbonization action as each sector has its own levers. This allows the financial institution to pay more attention on those and be more specific and granular in its efforts. It is the reason why the sectoral score will be preferred in the scoring sector through higher weight. Sectoral score The sectoral score is structured along three dimensions with their own calculation: the first considers the fact that there were no investments in coal, the second that investments in Oil & Gas are only directed to help the sector transitioning ("flow" rationale, the variation of new investments on the primary market and “stock” rational, the variation of the share of the transition investments within the total exposure), and the third considers the speed of the growth of the share of AuM dedicated to the transition in other high emitting sectors ("stock" approach, the variation of the share of the transition investments within the total exposure). All dimensions consider use of proceeds as well as general purpose instruments. Dimension 1: coal investments To score points on this component of the score, the financial institution should have no new primary investment at all in coal. This financial constraint reflects the real economy needs, as recommended by the science, to keep the coal unexploited in order to meet the 1.5°C global warming limitation objective. If new primary investment has been provided during the relevant period, the score is automatically set to zero. If no new primary investment has been made, the 100% score is multiplied by the “sectoral adjustment” SADJ, as defined in indicator 1.1.  Companies involved in coal are defined based on the Urgewald’s Global Coal Exit List (GCEL, https://www.coalexit.org). Dimension 2: O&G investments If the phase out from the oil & gas industry is not expected to be as steep as the coal’s one, scientific recommendations to meet the global warming limitation objective are to stop any new exploration and extraction of oil & gas fields and to transition the industry towards low carbon intensive energies. This will be represented in the score with those 2 sub-dimensions: New Primary Investment Score (NPIS): as there shall not be any new investment to develop the use of oil & gas, all new primary investments should be transition oriented or low carbon to transform the sector. The score is split between the use of the product and the company's overall objective and weighted by their share of total AuM exposure (average share over the last 3 years). Trajectory Alignment Score (TAS): as financial institutions’ AuM might be locked with some oil & gas investment for some years, the idea of this sub-dimension is to reflect the support of the sector’s transition by gradually increase the share of transition-oriented investments. This is presented with a TAS as defined above. The aggregated score is the average of the two subdimensions adjusted by the “sectoral adjustment”. 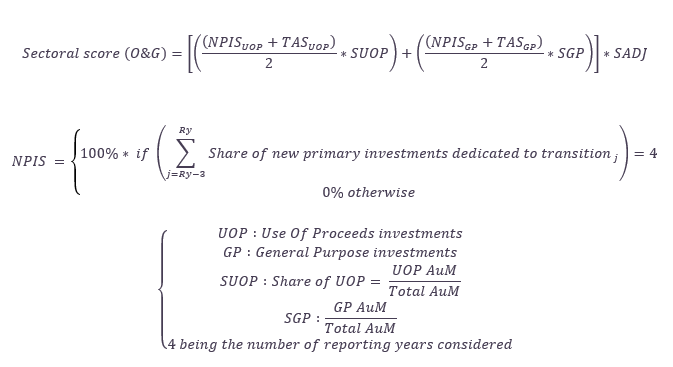
Companies involved in oil & gas are defined based on Urgewald’s Global Coal Exit List (https://www.coalexit.org). Dimension 3: other high emitting sector investment The score on the share of AuM dedicated to the transition in other high emitting sectors The score is a weighted average of the TAS for the proportion of Use of Proceeds instruments (SUOP) and General Purpose instruments (SGP) in overall investments.  Aggregated score The aggregate score is a straightforward addition of the scores of the three dimensions. 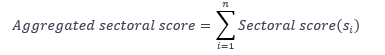 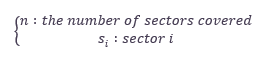 Asset class score The aggregate asset class score is a weighted average of the TAS for the proportion of Use of Proceeds instruments (SUOP) and general purpose instruments (SGP) in overall investments. 
With AADJ, the Asset class adjustment, being the asset class allocation at the reporting year: 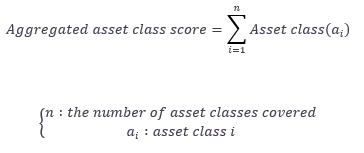 Aggregated score 
The aggregate score’s weights are defined depending on the combination of available data (sectoral data, asset class data) and based on the maturity score of its definitions of “green” and “transition”. Table 15: FINANCIAL FLOWS TREND SCORE’S WEIGHTINGS DEPENDING ON GRANULARITY OF TARGETS 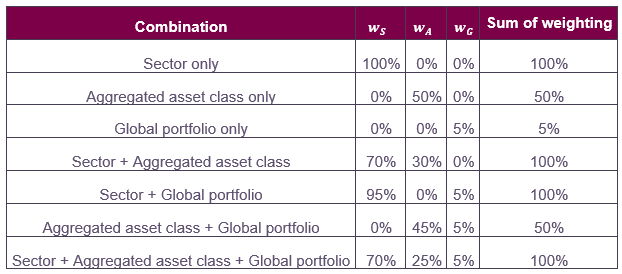 “Aggregated asset class” represents the case where the data is only available at the asset class level with no association to sectors. In the case where the data is available for a sector within an asset class, in terms of weighting consideration it will fall in the appellation of “sector” in the table above. The Maturity Score (MS) is needed as we acknowledge that the definition of “green” or “sustainable” might differ across different financial institutions depending on their maturity, geographic location, ambition, business model or applicable regulations. Same observation for the definition of a “transition plan” especially because it is a concept that was brought to light more recently. To avoid scoring discrepancies that it could bring; a maturity matrix is defined to score the financial institution’s maturity on those definitions. The Maturity Score (MS) is the weighted average to the following two questions: Table 16: Maturity score matrix 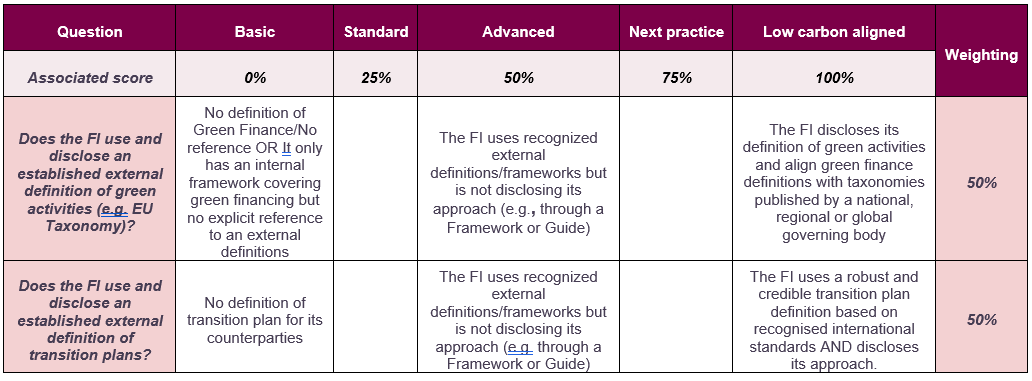 |
| Rationale | INV 4.1 Financial Flows trend |
| Rationale of the indicator |
Relevance of the indicator: When a company changes its production process and business model it can have a direct impact on the GHG emissions in the real economy while for a financial institution the direct impact of changing its portfolio allocation and thus business model, will be at portfolio level meaning its financed emission will be reduced but it does not mean that it will have impacted the emissions of the underlying companies. The correlation between financed emission reduction and GHG emission in the real economy is difficult to prove at an aggregated level. Stop investing in a company doesn’t mean its production will stop as it can raise money/benefit from capital elsewhere. Portfolio GHG emission accounting will only take into consideration the portfolio allocation which is much more liquid than a productive asset for a corporate. Selling emissive portfolio assets will reduce the related financed emissions but not the company’s emissions. Hence, this indicator will not focus on portfolio level financed emission or implied temperature rating but rather on the assessment of whether the investments are supporting the transition to a low carbon economy through (i) low carbon/enabling activities or (ii) companies with a robust and credible transition plan. A focus has been made on the fossil fuel sector as not all sectors can transition or with the same priority. That’s why it is treated differently in order to reflect science recommendation: stopping the use of coal and transition the oil & gas industry with no new exploration or extraction project financed. Our approach in this ‘Climate Performance Module’ is that we are not assessing the GHG emissions of the Financial Institution tied to its financed emissions. What we want to measure is the contribution of the financial institution to financing the decarbonization of the economy. Currently, a 1.5°C aligned portfolio has a low real economy impact: it means that it finances pure players/climate best in class companies (cherry picking) and/or taxonomic activities while the main challenge is to finance the transition of high emitting sectors’ companies. Conversely, a portfolio with high financed emissions but proving to help high emitting sectors decarbonize has more impact in GHG emission in the real economy. Scoring rationale: As a general meaning we use investments directed to the transition as the ones made in:
There is no distinct indicator for ‘low-carbon’ and ‘in transition’ as both are needed, and we underline the role of financial institutions to support the real economy transition. It should invest in both with no preference giving its business model flexibility. (i) New primary market investments are only considered for fossil fuel Effectively, the ‘flow’ consideration will be only applied to the fossil fuel sector. Indeed, scientific reports are very clear on that, to limit global warming to 1.5°C with no or low overshoot, there can’t be any expansion or exploration projects financed and fossil fuel use should decrease as quick as possible. New capital allocation in this sector should only be towards the transition. For other sectors, there is no clear benchmark with enough granularity to compare new primary market investments to. Therefore, only the total exposure (the ‘stock’ consideration) will be assessed, as it should increase its financing share towards the transition. For coal, the total AuM exposure is not taken into consideration as the climate issues topic is less mature in the financial sector than in other industries. That’s why the past financing (older than 3 years) will not be penalised however there a strict no new primary investment approach. For the oil & gas, new primary investments are allowed but only when they support the transition of the industry. The total AuM exposure is also taken into consideration with an expectation to increase over time. (ii) Total exposure evolution on the past three years towards the transition As stated in the previous paragraph coal is not assessed within this indicator as it is not considered as a sector that could transition. Hence, the important assessment is whether new capital has been allocated to it or not (‘flow’ rationale). For oil & gas both the ‘flow’ and the ‘stock’ rationale are assessed but that doesn’t lead to scoring redundancy as they reflect different aspects: the ‘flow’ approach is about capital allocation and the ‘stock’ approach is about the price signal. For the other sectors, there is no data available now allowing to provide at a sector level what should be a fair share of financing that should be directed towards the transition every year. That’s why new primary investments are not considered but only the total AuM exposure which is expected to increase over time towards the transition. Please find in annexe 11.3 some illustrative examples on how the trend ratio works. |
5.3.4.2 INV 4.2 Portfolio emissions assessment
| Description & Requirements | INV 4.2 Portfolio emissions assessment |
|---|---|
| Short description of indicator |
Assessment of the portfolio emissions alignment exercise and expected outcome. Answers the following questions:
|
| Data requirements |
The relevant data for this indicator are:
CDP Questionnaire 2022 mapping to this indicator:
|
| How the assessment will be done |
The analyst will have to conduct a comprehensive analysis of the portfolio alignment exercise, understanding if the latter is ambitious enough (scope, financed emissions representativeness, does it lead to the identification of the relevant assets?). Asset Managers & Asset Owners (direct investment) 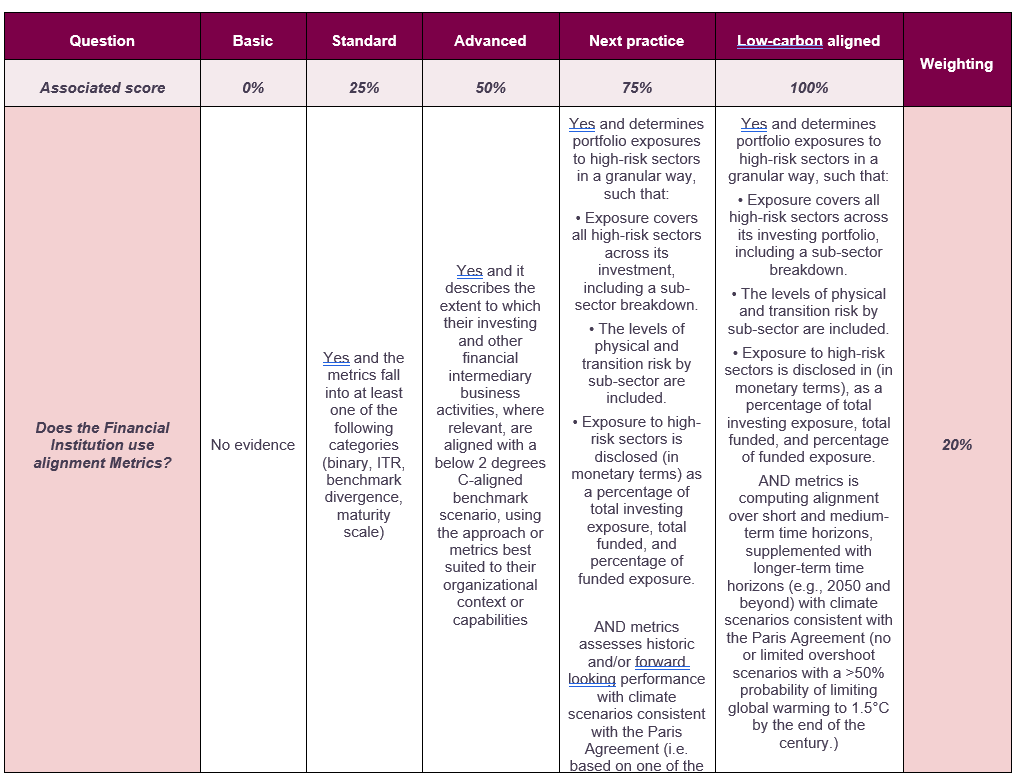      |
|
*the metric assessment shall be based on the following criteria coming from Table 2 of the GFANZ report on ‘Measuring portfolio Alignment: driving enhancement, convergence; and Adoption (November 2022)) (15)
To calculate the %, the analyst must score the metric through these 5 criteria. The result out of 5 gives a %. If several metrics exist, the analyst shall conduct the analysis on each metric and calculate the average score. Asset Owners (mandating asset managers)       *the metric assessment shall be based on the following criteria coming from Table 2 of the GFANZ report on ‘Measuring portfolio Alignment: driving enhancement, convergence; and Adoption (November 2022)) (15)
To calculate the %, the analyst must score the metric through these 5 criteria. The result out of 5 gives a %. If several metrics exist, the analyst shall conduct the analysis on each metric and calculate the average score.
|
|
| Rationale | INV 4.2 Portfolio emissions management |
| Rationale of the indicator |
Relevance of the indicator: Even though portfolio alignment outputs give low information in terms of impact, the outcomes are still very important as it is a key step to build/design an impactful engagement strategy with relevant assets/actors. The score of this module will reflect whether the financial institution is conducting this exercise with methodological rigor and able to determine who is responsible for its financed emissions, condition sine qua none to start looking for impact actions (through engagement). |