Note:
ACT - Finance - Banks (Section 5.3.5.1 to Appendix)
Please Read Before Providing Comments
Thank you for taking the time to review the ACT Finance Banks methodology.
Instructions: Reviewing the ACT Finance Methodology
If you want to provide comments – click on the new comment button located on the right side.

You will be asked to register by clicking on the yellow register button.

If you are already registered on ScribeHub, please sign in (top right corner) before accessing the document and commenting.

Registering
If you are not already registered to ScribeHub, you will be asked to register on the platform - providing your email address, name and creating a password. You will then be sent a confirmation email. Click on the Confirm my account link in the email and you will be redirected to the login screen for ScribeHub. Enter you email and password and you will then have access to the document.
Please note that your name and email address will be used by the ACT team to record the list of people providing comments during this public consultation. Remember the email and password you use to register as this information will always be required to log in to ScribeHub.
Commenting
Once on ScribeHub, please use the comment button

beside each section header to input your feedback. Pressing on the + sign will open a dialog box where you can input the title of your comment, the related section of the document, and your comment. Keep in mind that comments are publicly visible. You can also reply directly to a comment already posted.
The methodology will be proofread before publication, so no need to flag minor editing issues.
Timeline
Please provide your feedback by February 10, 2023
Contact
If you encounter any problems at all with the ScribeHub platform please contact Patrick Hardy.
You can also download the ACT Framework from the ACT website for more context.
Thank you!
Thank you once again for providing valuable feedback, we look forward to reviewing it
5. Construction of Data Infrastructure
5.3 Performance Indicators
5.3.5 Module 5: Management
The indicator assesses the incorporation of climate strategy into its governance structure, remuneration policies and risk management.
5.3.5.1 LEN 5.1 Oversight of climate change issues
| Description & Requirements | LEN 5.1 Oversight of climate change issues |
|---|---|
| Short description of indicator | The financial institution discloses that responsibility for climate change mitigation within the financial institution lies at the highest level of decision-making within the financial institution structure. |
| Data requirements |
The relevant data for this indicator are:
CDP Questionnaire mapping to this indicator:
External sources of data may also be used for the analysis of this indicator. |
| How the assessment will be done |
The benchmark case is that climate change is managed within the highest decision-making structure within the financial institution. The position at which climate change is managed within the financial institution structure is determined from the financial institution data submission and accompanying evidence. If the corporate structure does not match the structure of the maturity matrix, the analyst should assign a score based on the financial institution’s specific hierarchy (i.e., if responsibility for climate change mitigation lies at the highest level of decision-making within the organization, award “Low-carbon aligned”. If responsibility lies one level below the highest level, award “Next practice”, etc.). The maturity matrix used for the assessment is the following: 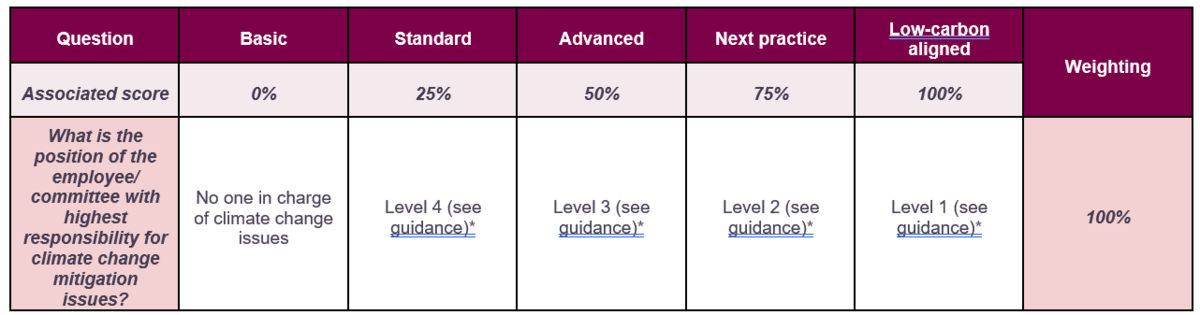
Further guidance for each level of seniority is given below: Level 1
Level 2
Level 3
Level 4
|
| Rationale | LEN 5.1 Oversight of climate change issues |
| Rationale of the indicator |
Successful change within financial institution, such as the transition to a low-carbon economy, requires strategic oversight and buy-in from the highest levels of decision-making within the financial institution. Evidence of how climate change is addressed within the top decision-making structures is a proxy for how seriously the company takes climate change, and how well integrated it is at a strategic level. High-level ownership also increases the likelihood of effective action to address low-carbon transition. Changes in strategic direction are necessarily future-oriented, which fits with this principle of the ACT initiative. Managing oversight of climate change is considered as a good practice. |
5.3.5.2 LEN 5.2 Climate change oversight capability
| Description & Requirements | LEN 5.2 Climate change oversight capability |
|---|---|
| Short description of indicator |
Financial institution board or executive management has expertise on the science and economics of climate change, including an understanding of policy, technology drivers that can disrupt current business. This expertise is used by the individual or committee to inform high-level decision-making within the financial institution. The employees, receives specific and adapted climate training to align their business activities with financial institutions climate objectives. |
| Data requirements |
The relevant data for this indicator are:
CDP Questionnaire mapping to this indicator:
External sources of data may also be used for the analysis of this indicator. |
| How the assessment will be done |
The presence of expertise on topics relevant to climate change and the low-carbon transition at the level of the individual or committee with overall responsibility for it within the company is assessed. The presence of expertise is the condition that must be fulfilled for points to be awarded in the scoring. The analyst determines if the financial institution has expertise as evidenced through a named expert biography outlining capabilities. A cross-check is performed against 5.1 on the highest responsibility for climate change, the expertise should exist at the level identified or the relationship between the structures/experts identified should also be evident. To be awarded Low-carbon aligned, the financial institution must provide examples of how the individual or committee’s expertise has informed credit allocation and/or decision-making processes. The maturity matrix used for the assessment is the following: 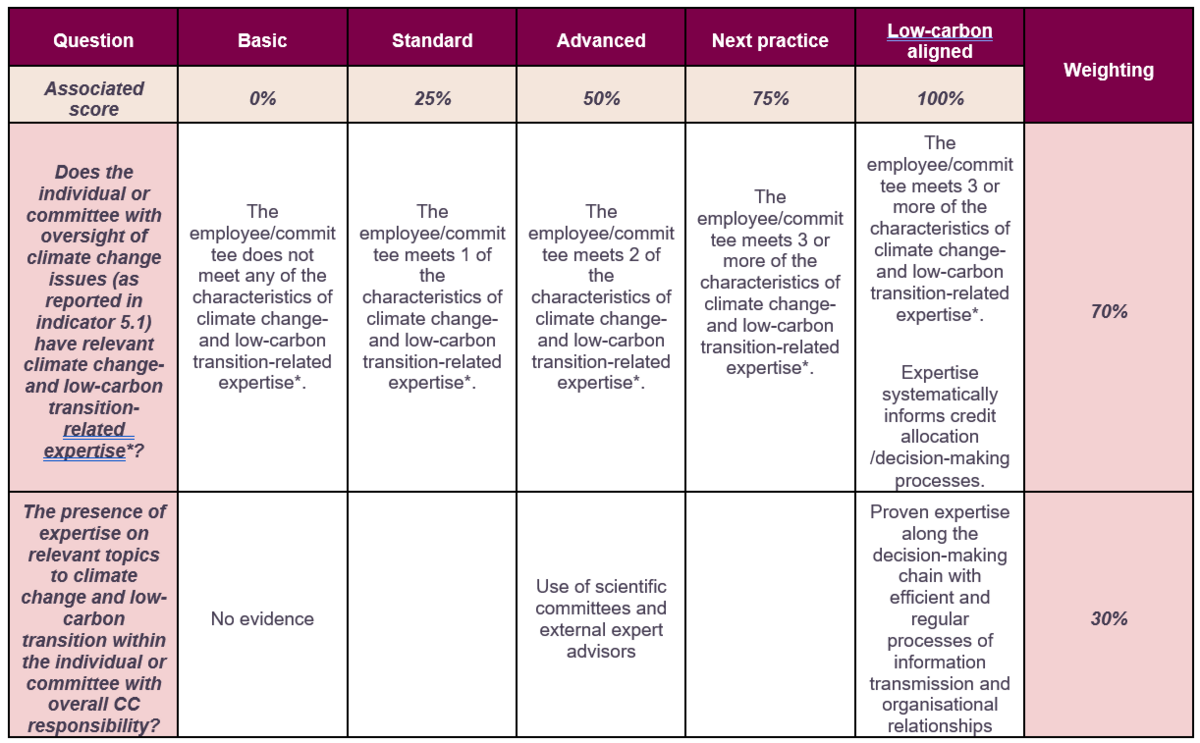 “Characteristics of climate change- and low-carbon transition-related expertise” include:
|
| Rationale | LEN 5.2 Climate change oversight capability |
| Rationale of the indicator |
Effective management of the low-carbon transition requires specific expertise related to climate change and its impacts, and their likely direct and indirect effects on the business. Presence of this capability within or closely related to the decision-making bodies that will implement low-carbon transition both indicates financial institution commitment to that transition and increases the chances of success. Even though financial institutions are managing climate change at the Board level or equivalent level, a lack of expertise could be a barrier to successful management of low-carbon transition. |
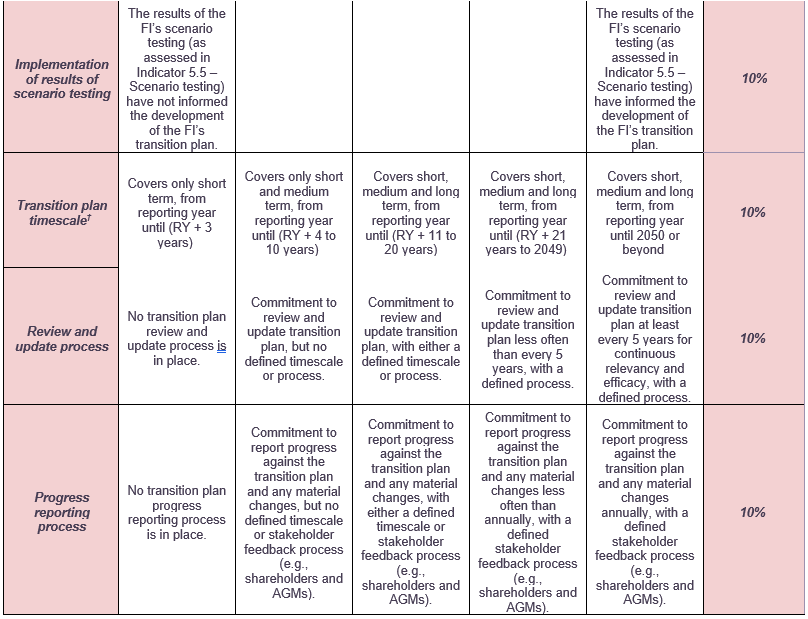
5.3.5.3 LEN 5.3 Low-carbon transition plan
| Description & Requirements | LEN 5.3 Low-carbon transition plan |
|---|---|
| Short description of indicator | The financial institution has a plan on how the financial institution can contribute to financing the transition towards a low-carbon economy |
| Data requirements |
The relevant data for this indicator are:
CDP Questionnaire applying to this indicator:
|
| How the assessment will be done |
    |
| Rationale | LEN 5.3 Low-carbon transition plan |
| Rationale of the indicator | All the sectors, including the finance one, will require substantial changes to their business to contribute to a low-carbon economy, over the short, medium and long term, whether it is voluntarily following a strategy to do so or is forced to change by regulations and structural changes to the market. It is better from a risk perspective and impact approach that the changes tied to the transition occur in a planned and controlled manner. |
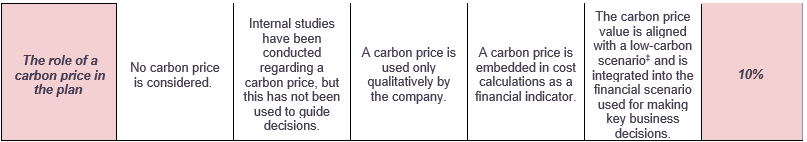
5.3.4.4 LEN 5. 4 Climate change management incentives
| Description & Requirements | LEN 5.4 Climate change management incentives |
|---|---|
| Short description of indicator | The Board’s compensation committee has included metrics for the reduction of GHG emissions in the annual and/or long-term compensation plans of senior executive and front office employees. The company provides financial incentives for the management of climate change issues as defined by a series of relevant indicators. |
| Data requirements |
The relevant data for this indicator are:
CDP Questionnaire mapping to this indicator:
|
| How the assessment will be done |
The analyst verifies if the financial institution has compensation incentives set for senior executive compensation and/or bonuses, that directly and routinely reward specific, measurable financing reduction emissions and/or the future attainment of emissions reduction targets, or other metrics related to the financial institution’s low-carbon transition plan. For cases in which the financial institution's structure does not match the one of the maturity matrix, the assessor should assign a score based on the financial institution’s specific hierarchy (i.e., if climate change management incentives are awarded to the highest level of decision-making within the organization, award “Low-carbon aligned”. If incentives are available one level below the highest level, award “Next practice”, etc.). Note: the wording of the “What is the type of incentive” is based on the Executive Compensation Guidebook for Climate Transition developed by Willis Towers Watson, in partnership with the Climate Governance Initiative, a project in collaboration with the World Economic Forum 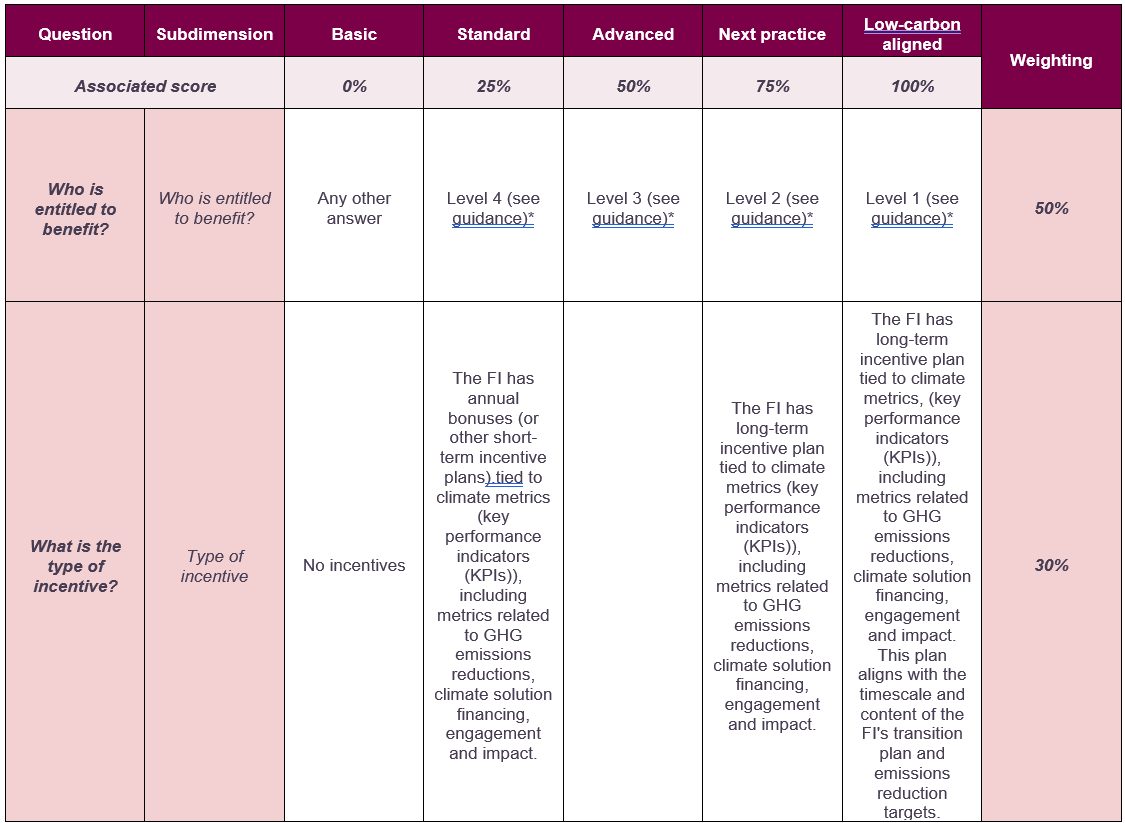 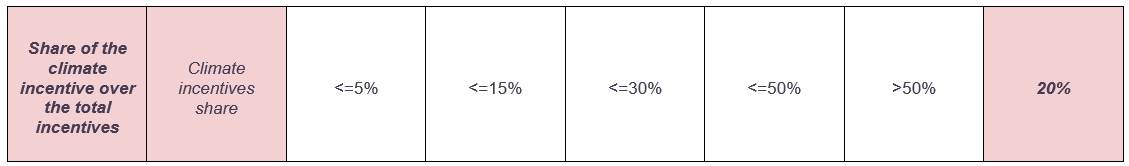 Further guidance for each level of seniority is given below: Level 1
Level 2
Level 3
Level 4
|
| Rationale | LEN 5.4 Climate change management incentives |
| Rationale of the indicator |
Executive compensation should be aligned with overall business strategy and priorities. As well as commitments to action the company should ensure that incentives, especially at the executive level, are in place to reward progress towards low-carbon transition. This will improve the likelihood of successful low-carbon transition. Monetary incentives at the executive level are an indication of commitment to successful implementation of a strategy for low-carbon transition. |
5.3.5.5 LEN 5.5 Climate risk management
| Description & Requirements | LEN 5.5 Climate risk management |
|---|---|
| Short description of indicator | The financial institution is fully considering climate as a systemic risk. As a result, it is integrating climate in its own risk management process, informing its global strategy, and impacting its granting conditions (e.g. climate has a direct impact on the pricing of a loan, Green/Brown Supporting Factor) |
| Data requirements |
The relevant data for this indicator are:
CDP Questionnaire mapping to this indicator:
|
| How the assessment will be done |
The analyst evaluates the description and evidence of the integration of climate risk in its risk management process and strategy 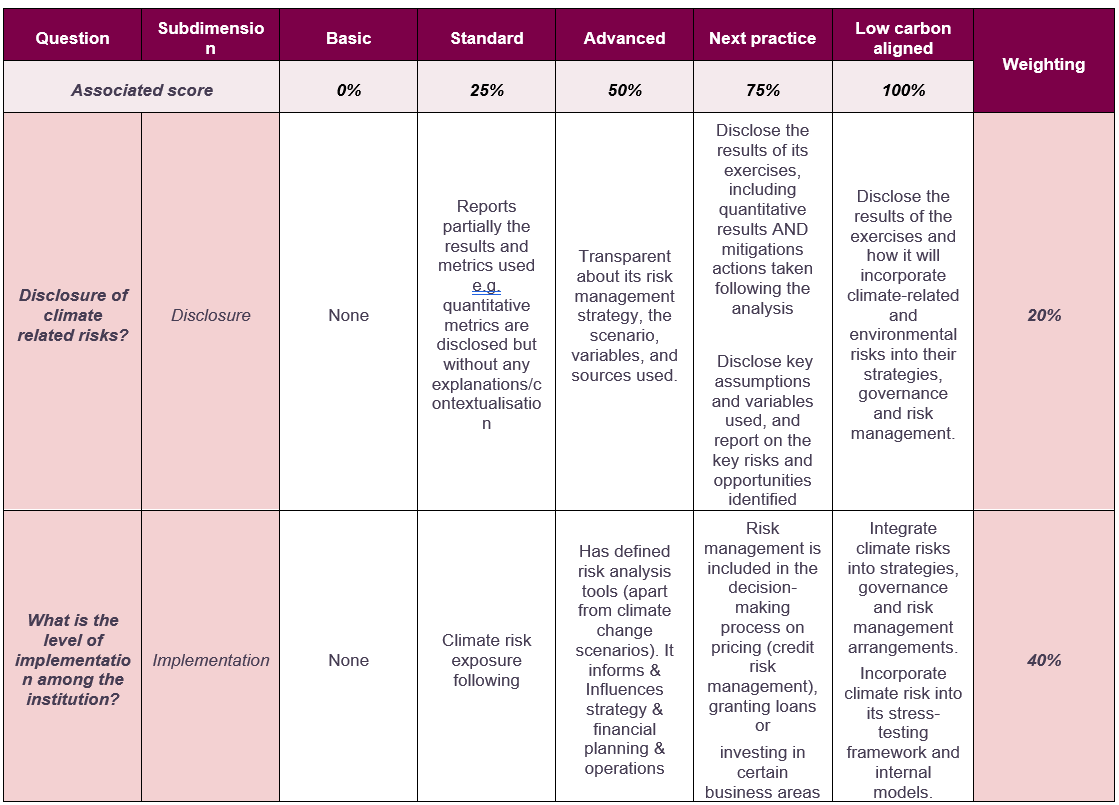 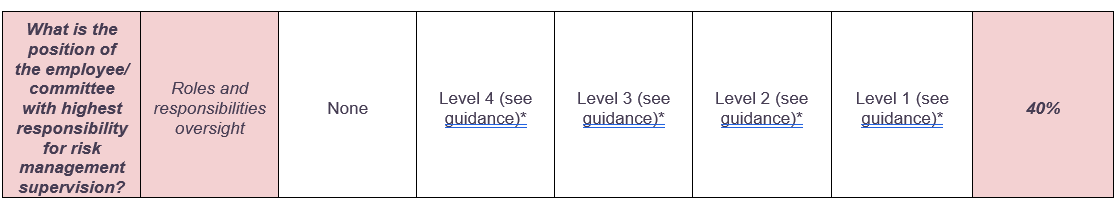 Level 1
Level 2
Level 3
Level 4
|
| Rationale | LEN 5.5 Climate risk management |
| Rationale of the indicator |
Climate has been explicitly identified as a financial risk for years now (25). According to European supervisors, Banks are not on the track to follow their climate risk exposure and managing it (‘a wait-and-see approach is still prevalent’) (26). Even though climate change scenario analysis and testing have turned to be a common practice (with a large heterogeneity (27) in its exercise but this will be the topic of the next section 5.6), climate risk management itself is still lagging in terms of best practice (28) (definition of a climate risk strategy, deployment and implementation, governance, allocation of roles & responsibilities associated with it). 25. Breaking the tragedy of the horizon – climate change and financial stability – speech by Mark Carney. Speech given at Lloyd’s of London. https://www.bankofengland.co.uk/speech/2015/breaking-the-tragedy-of-the-horizon-climate-change-and-financial-stability. 27. https://www.bankingsupervision.europa.eu/ecb/pub/pdf/ssm.climateriskstresstest2021~a4de107198.en.pdf. Expectation: ‘Institutions are expected to incorporate climate-related and environmental risks as drivers of existing risk categories into their risk management framework, with a view to managing, monitoring and mitigating these over a sufficiently long-term horizon, and to review their arrangements on a regular basis.3 |
5.3.5.6 LEN 5.6 Climate change scenario testing
| Description & Requirements | LEN 5.6 Climate change scenario testing |
|---|---|
| Short description of indicator | Assessing bank’s climate risk stress-testing framework. |
| Data requirements |
The relevant data for this indicator are:
CDP Questionnaire mapping to this indicator:
|
| How the assessment will be done |
The analyst evaluates the description and evidence of the climate scenario testing for the presence of best-practice elements and consistency with the other reported management indicators. The financial institution description and evidence are compared to the maturity matrix developed to guide the scoring and a greater number of points is allocated for elements indicating a higher level of maturity. Best-practice elements to be identified in the test/analysis include:
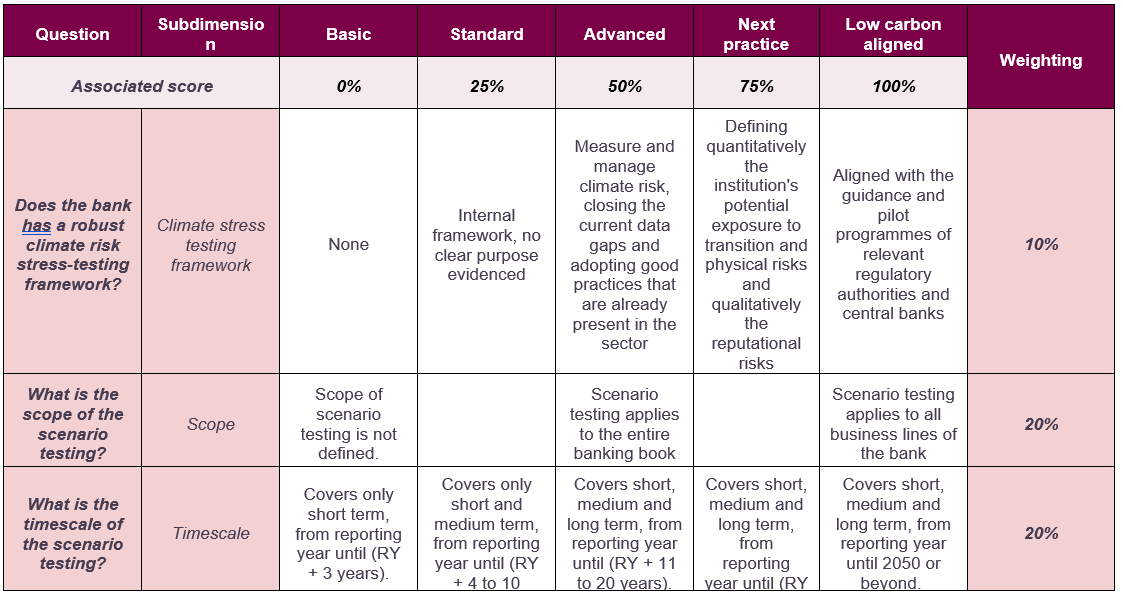 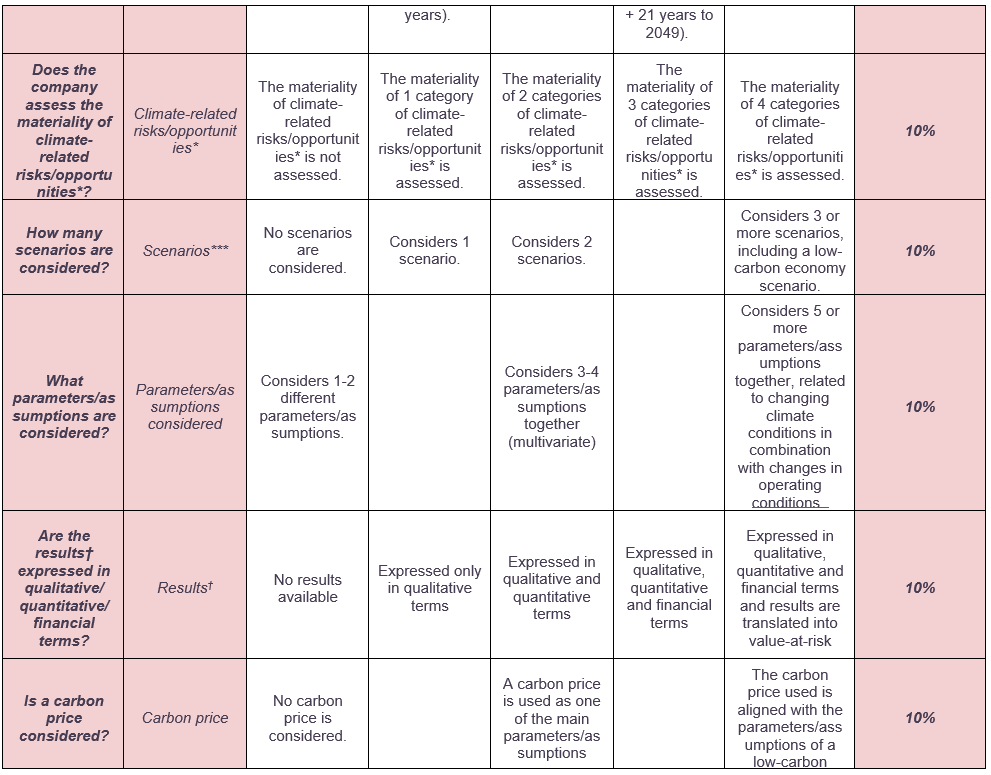
Results of stress testing should be presented as business impacts which can include consideration of: Scale: What is the order of magnitude of the potential impact? Timeframe: What can I conclude about the possible timescales over which this will emerge? Asset classes and sectors: What does my analysis tell me about the differential impact of climate change on different asset classes and/or sectors? Valuation: Can I draw out lessons from the way I value individual companies or assets (quantitative or qualitative)? Trends and drivers: What does the analysis tell me about the signals to watch for in order to track climate risks in specific asset classes, sectors or companies? Refer for instance to International Energy Agency (IEA), World Energy Outlook 2019, Annex B, p 758 (30). CO2 prices are displayed by world regions, predicted values in 2030 and 2050. |
| Rationale | LEN 5.6 Climate change scenario testing |
| Rationale of the indicator |
There are a variety of ways of analysing the potential impacts of climate-related changes on a bank, whether these are slow and gradual developments or one-off “shocks”. Supervisors are increasingly calling for techniques such as use of an internal price on carbon, scenario analysis and stress testing to be implemented to enhance banks’ ability to assess climate-related risk. To date, around 60% of European banks do not yet have a climate risk stress-testing framework. It is key to integrate climate risk scenarios into their stress-testing models, with both physical and transition risks, as well as long-and short-term horizons. Scenario stress testing is an important management tool to account for various transmission channels and asset classes. It is important for financial institution to understand the businesses likely to be strongly affected by climate change impacts (both direct and indirect). As this practice is still to be fully onboarded by banks, the ACT methodology thus provides a broad definition of types of testing and analysis which can be relevant to this information requirement, to identify both current and best practices and consider them in the analysis. |
5.3.6 Module 6: Savers engagement
5.3.6.1 LEN 6.1 Strategy to influence savers
| Description & Requirements | LEN 6.1 Strategy to influence savers |
|---|---|
| Short description of indicator |
This indicator assesses the strategic policy and the process which are formalized and implemented into business decision making process to influence, enable or otherwise shift savers’ choices and behaviours in order to reduce:
|
| Data requirements |
The relevant data for this indicator are:
External sources of data may also be used for the analysis of this indicator. |
| How the assessment will be done |
The assessment will assign a maturity score based on the financial institution’s formalized, written strategy regarding its engagement with its savers (corporates and individuals), expressed in a maturity matrix. A financial institution that is placed in the ‘Low-carbon aligned’ category will receive the maximum score. A financial institution which is at a lower level will receive a partial score, with 0 points awarded for having no engagement at all. 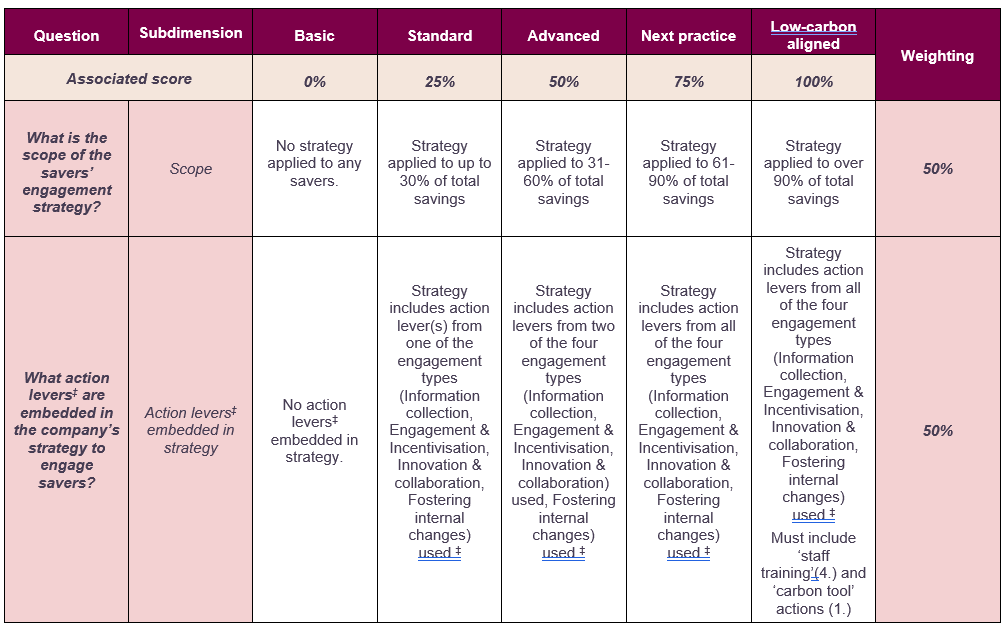 Indicative (non-exhaustive) list to help in the matrix assessment: ‡ 1. Information collection (understanding savers behavior) - Collect climate change and carbon preferences at least annually from savers - Promote or develop tools to enable clients calculate the carbon footprint of their lifestyle/activities or assess their contribution to Paris Agreement mitigation goal (for corporates e.g. ACT Step by Step or ACT assessment) 2. Engagement & incentivization (changing savers behavior) - Run an engagement campaign to educate savers about climate change/GHG emissions reductions/other low-carbon transition-related topics for their saving schemes - Offer financial incentives for savers directing their savings towards climate solutions/low carbon activities/helping companies to transition - Provide climate-related training, support, and best practices - Directly work with savers on climate-related topics, such as defining common GHG emission reduction plans for their saving schemes - Promoting sustainable consumption 3. Innovation & collaboration (changing markets) - Run a campaign to encourage innovation to reduce climate impacts on products and services - Collaborate with savers on innovative low-carbon/transition savings products - Report on savings schemes' climate performance to savers 4. Fostering internal changes (teams/tools/processes) - Regular staff training and upskilling on climate-related topics and related saving schemes - Incentivization of relationship managers to put forward climate-positive solutions or funds |
| Rationale | LEN 6.1 Strategy to influence savers |
| Rationale of the indicator |
Relevance of the indicator: Deposits are a key financial resource for many credit institutions. The deposit relationship, whether with a corporate or a retail (consumer) saver, is often one entry point for the institution in order to provide other product and services. Savers engagement is included in this ACT methodology for the following reasons:
Savers can be whether corporates or consumers:
Scoring the indicator: Because of data availability and complexity, a direct measure of the outcome of such engagement is not very feasible at this time. Because there is no taxonomic labelled fund savers (individuals or corporates) could place their money in or because the additionality of the engagement actions made with corporates or individuals is not measurable, the approach of a maturity matrix allows the analyst to consider multiple dimensions of savers engagement and assess them together towards a single score for savers Engagement. |
5.3.6.2 LEN 6.2 Activities to influence savers
| Description & Requirements | LEN 6.2 Activities to influence Savers |
|---|---|
| Short description of indicator | This indicator assesses the extent to which the financial institution implements activities and initiatives that help, influence or otherwise enable savers to reduce their GHG emissions. The indicator aims to be a holistic measure of these activities and initiatives, with evidence of implementation and outcomes in the value chain across all products/services. |
| Data requirements |
The relevant data for this indicator are:
External sources of data may also be used for the analysis of this indicator. |
| How the assessment will be done |
The assessment will assign a maturity score based on the financial institution’s demonstration of recent and current activities with its savers, expressed in a maturity matrix. A financial institution that is placed in the ‘Low-carbon aligned’ category will receive the maximum score. A company which is at a lower level will receive a partial score, with 0 points awarded for having no engagement at all. This maturity matrix is indicative but does not show all possible options that can result in a particular score. The financial institution’s responses will be scrutinized by the analyst and then placed on the level in the matrix where the analyst deems it most appropriate. 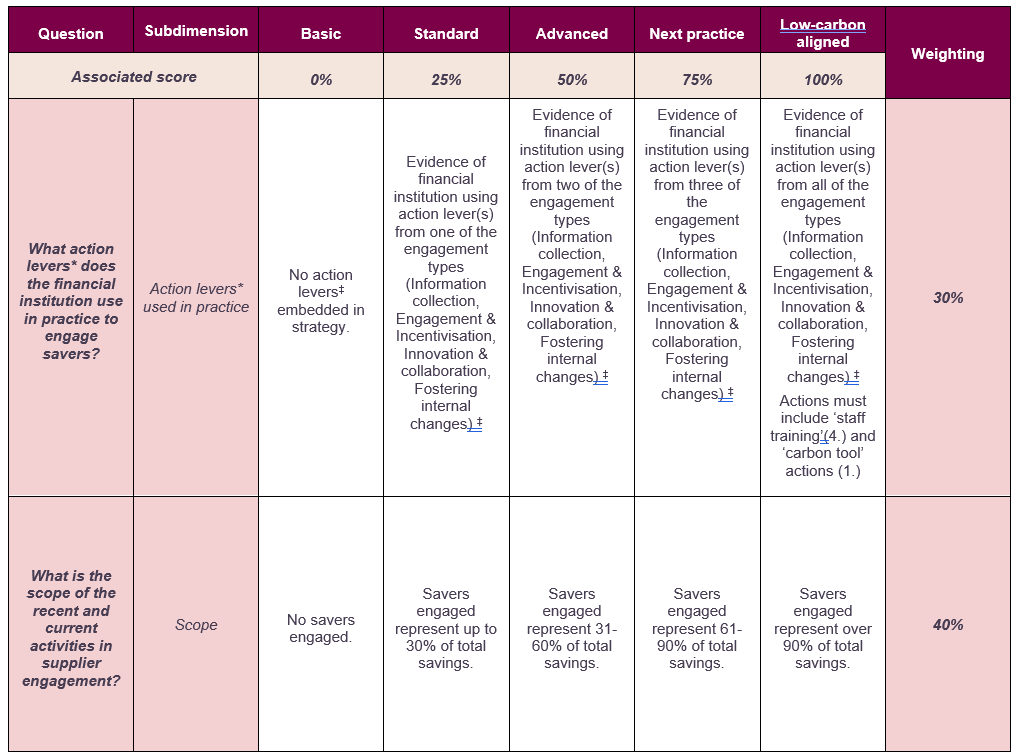 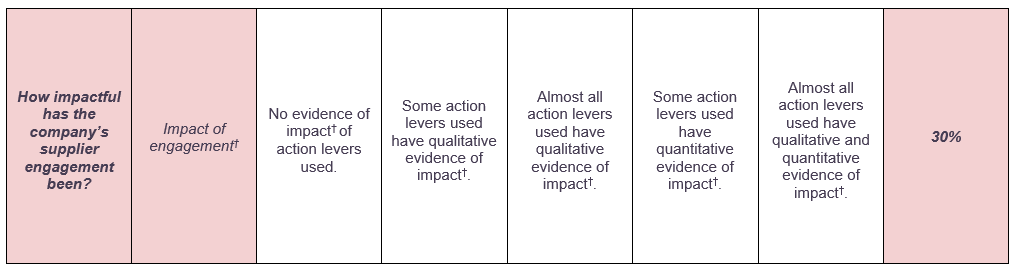 Action levers must be presented as examples of past/present actions/initiatives, and not be theoretical/embedded in a strategy document (such examples should be scored in indicator 6.1). “Action levers” include, but are not limited to, the following examples, which are grouped into four engagement types (sources: 2022 CDP climate change questionnaire C12.1): Indicative (non-exhaustive) list to help in the matrix assessment: 1. Information collection (understanding savers behavior) - Collect climate change and carbon preferences at least annually from savers - Promote or develop tools to enable clients calculate the carbon footprint of their savings/activities or assess their contribution to Paris Agreement mitigation goal (for corporates e.g. ACT Step by Step or ACT assessment) 2. Engagement & incentivization (changing saver behavior) - Run an engagement campaign to educate savers about climate change/GHG emissions reductions/other low-carbon transition-related topics for their saving schemes - Offer financial incentives for savers directing their savings towards climate solutions/low carbon activities/helping companies to transition - Provide climate-related training, support, and best practices - Directly work with savers on climate-related topics, such as defining common GHG emission reduction plans for their saving schemes - Promoting sustainable consumption 3. Innovation & collaboration (changing markets) - Run a campaign to encourage innovation to reduce climate impacts on products and services - Collaborate with savers on innovative low-carbon/transition savings products - Report on savings schemes' climate performance to savers 4. Fostering internal changes (teams/tools/processes) - Regular staff training and upskilling on climate-related topics and related saving schemes - Incentivization of relationship managers to put forward climate-positive solutions or funds 'The metric used to measure impact depends on the action lever the metric refers to. Examples of “evidence of impact” might include, but are not limited to: o Qualitative example: Feedback from savers e.g. consumers finding insightful to get insights on their behaviors or saying that they appreciate and will use this new knowledge to start their journey on the low-carbon transition o Quantitative example: Increase of X% in sustainable financial products/preferences o Quantitative example: Increase of X% in savers conducting a carbon accounting assessment |
| Rationale | LEN 6.2 Activities to influence savers |
| Rationale of the indicator |
Relevance of the indicator: Savers engagement is included in this ACT methodology for the following reasons:
Savers can be whether corporates or consumers:
Scoring the indicator: Because of data availability and complexity, a direct measure of the outcome of such engagement is not very feasible at this time. Because there is no taxonomic labelled fund savers (individuals or corporates) could place their money in or because the additionality of the engagement actions made with corporates or individuals is not measurable, the approach of a maturity matrix allows the analyst to consider multiple dimensions of savers engagement and assess them together towards a single score for savers Engagement. |
5.3.7 Module 7: Clients engagement
5.3.7.1 LEN 7.1 Strategy to influence clients
| Description & Requirements | LEN 7.1 Strategy to influence clients |
|---|---|
| Short description of indicator | The financial institution has an engagement strategy, ideally governed by policy and integrated into business decision making, to influence, enable, or otherwise shift clients’ business model/activities in order to reduce GHG emissions. |
| Data requirements |
The relevant data for this indicator are:
External sources of data may also be used for the analysis of this indicator. |
| How the assessment will be done |
The assessment will assign a maturity score based on the financial institution’s formalized, written strategy regarding its engagement with its counterparties, expressed in a maturity matrix. A financial institution placed in the ‘Low-carbon aligned’ category will receive the maximum score. Conversely, a financial institution at a lower level will receive a partial score, with 0 points awarded for having no engagement at all. 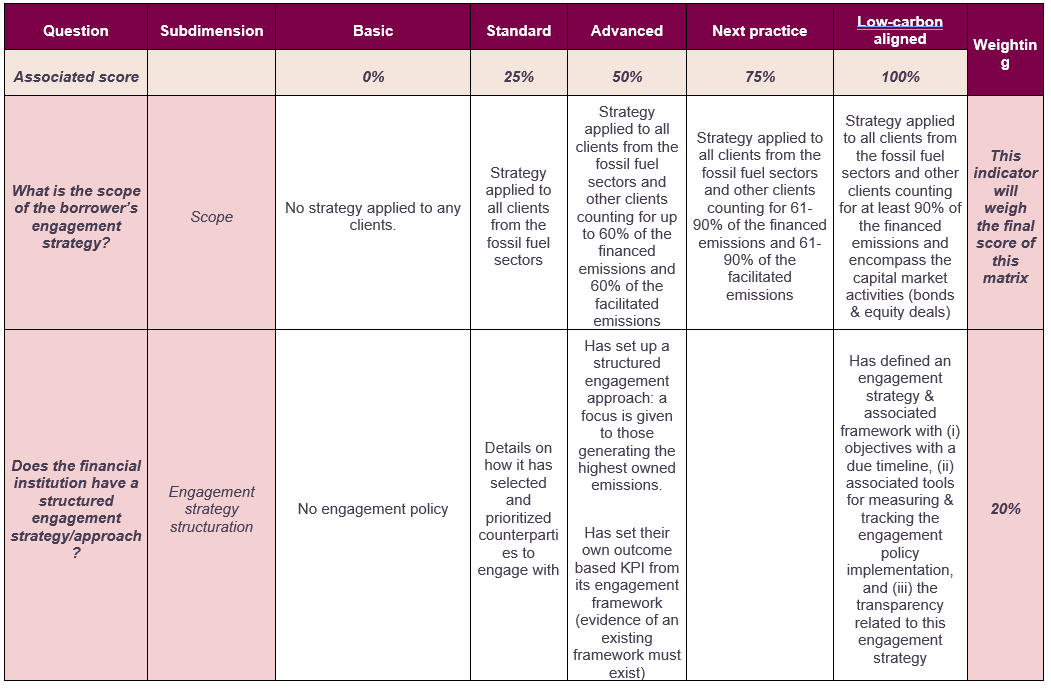 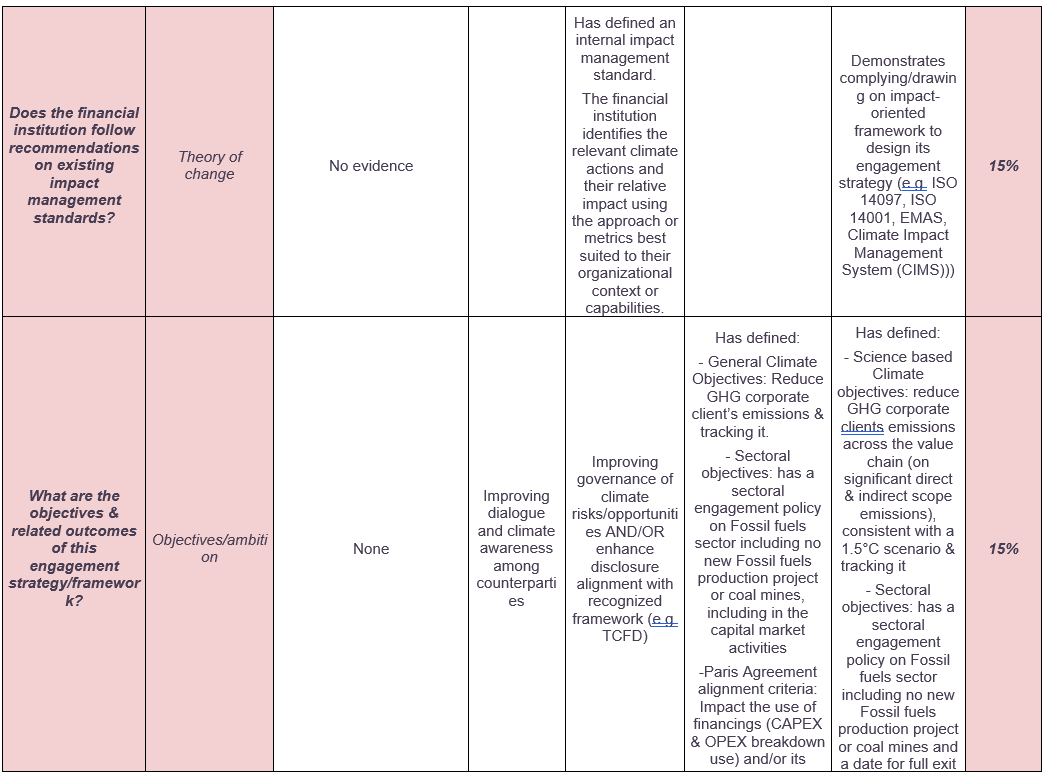 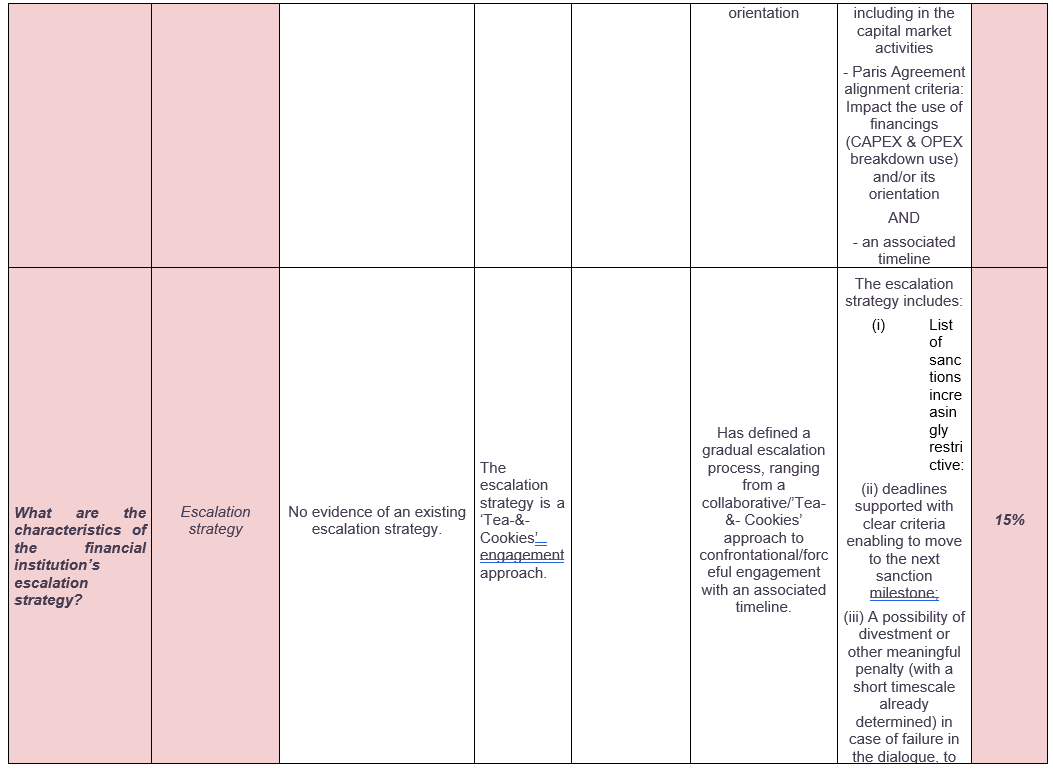 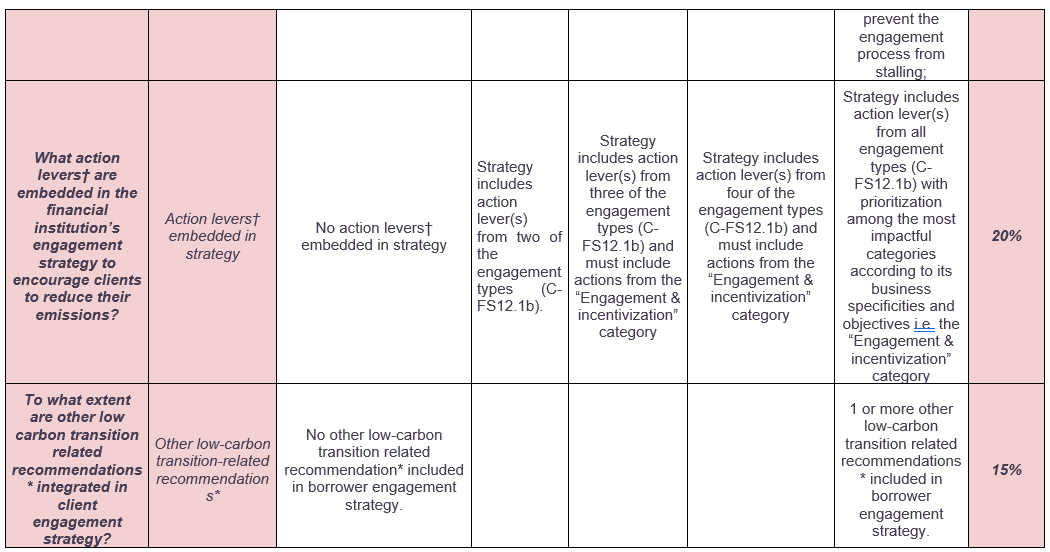 “Other low-carbon transition-related recommendations” refers to key aspects of a counterparty’s low-carbon transition, beyond emissions reductions and targets, that financial institutions can engage them on. These aspects can include performance indicators from any ACT performance modules, such as:
Action levers must be embedded in a strategy document, and not be presented as examples of past/present actions/initiatives (such examples should be scored in indicator 7.2). “Action levers” include but are not limited to the following individual action levers, which are grouped into five engagement types (sources: 2022 CDP climate change questionnaire CDP 12.1b (C-FS12.1b) (Banking/Asset manager):
|
| Rationale | LEN 7.1 Strategy to influence clients |
| Rationale of the indicator |
Relevance of the indicator: Strategies to influence counterparties are included in this ACT methodology for the following reasons:
Scoring the indicator: Because of data availability and complexity, a direct measure of the outcome of such engagement is not very feasible at this time. It is often challenging to quantify the emission reduction potential and outcome of collaborative activities with the borrower. Therefore, the approach of a maturity matrix allows the analyst to consider multiple dimensions of engagement and assess them together towards a single score for a strategy related to engagement with clients. |
5.3.7.2 LEN 7.2 Activities to influence clients
| Description & Requirements | LEN 7.2 Activities to influence clients |
|---|---|
| Short description of indicator | This indicator assesses the extent to which the financial institution implements activities and initiatives that help, influence or otherwise enable clients to reduce their GHG emissions. The indicator aims to be a holistic measure of these activities and initiatives, with evidence of implementation and outcomes in the clients value chain across all products/services. |
| Data requirements |
The relevant data for this indicator are:
CDP Questionnaire mapping to this indicator:
External sources of data may also be used for the analysis of this indicator. |
| How the assessment will be done |
The assessment will assign a maturity score based on the financial institution’s demonstration of recent and current activities and initiatives with its clients, expressed in a maturity matrix. A financial institution that is placed in the ‘Low-carbon aligned’ category will receive the maximum score. A financial institution which is at a lower level will receive a partial score, with 0 points awarded for having no engagement at all. This maturity matrix is indicative but does not show all possible options that can result in a particular score. The financial institution’ responses will be scrutinized by the analyst and then placed on the level in the matrix where the analyst deems it most appropriate. 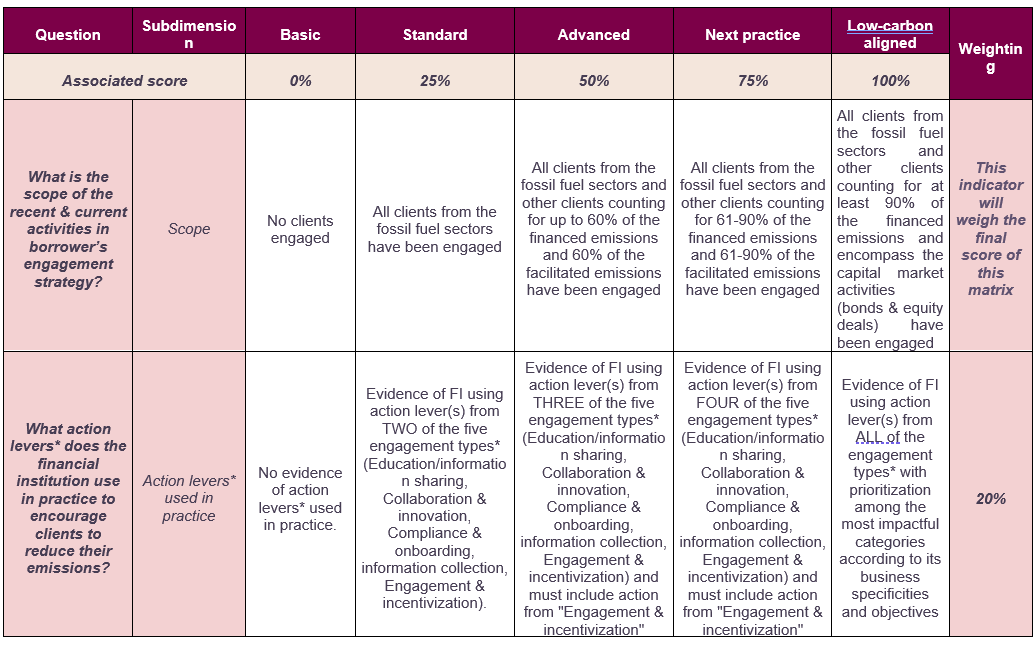 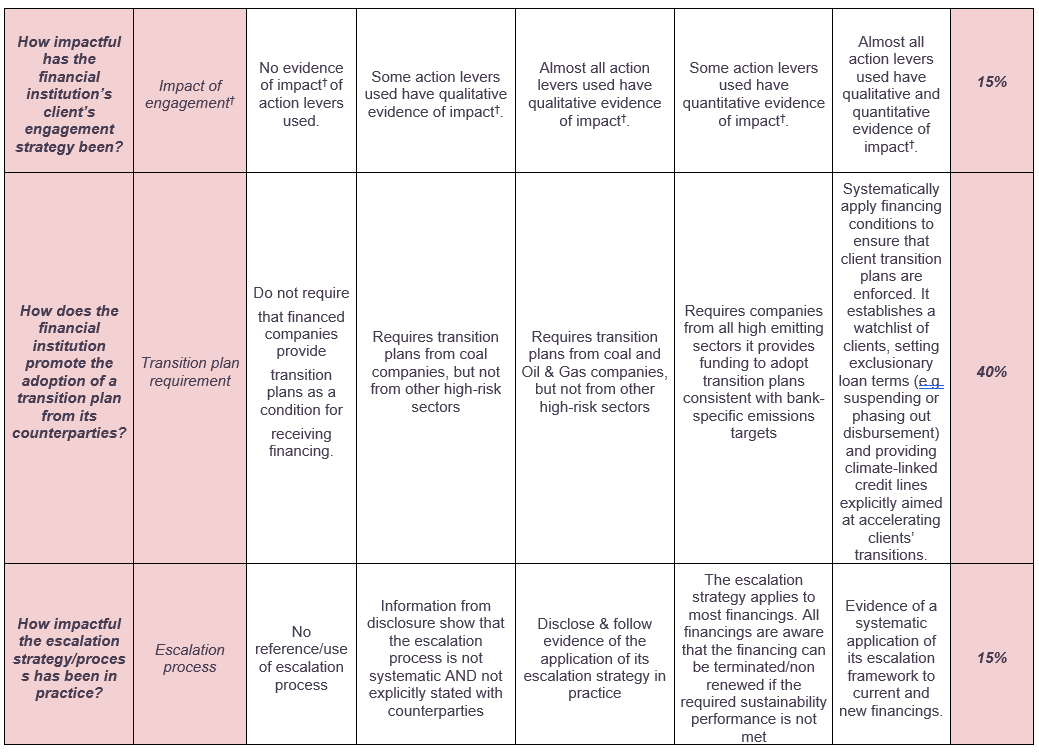 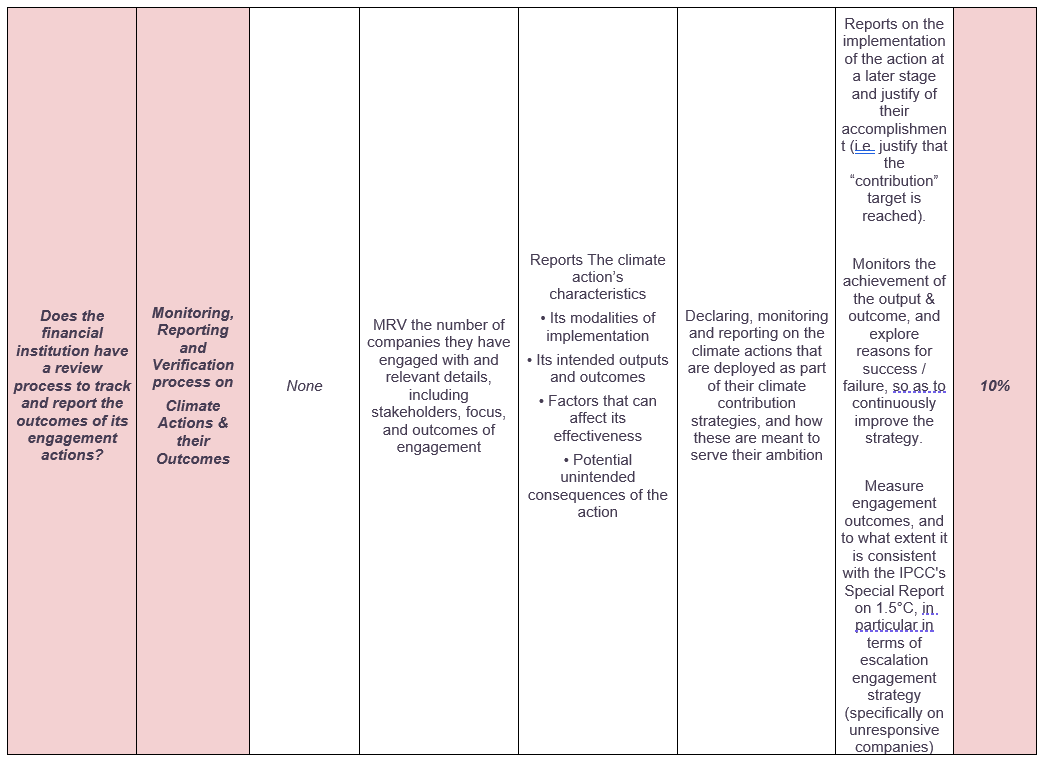
|
| Rationale | LEN 7.2 Activities to influence clients |
| Rationale of the indicator |
Relevance of the indicator: Activities to influence clients are included in this ACT methodology for the following reasons: Financial institutions have the ability to influence the climate strategy and performance of clients through their financial products or services (capital market). The downstream money value chain represents the largest source of emissions and risks for financial institutions and must be addressed through a proper ambitious engagement strategy. Scoring the indicator: Because of data availability and complexity, a direct measure of the outcome of such engagement is not very feasible at this time. It is often challenging to quantify the emission reduction potential and outcome of engagement activities. Therefore, the approach of a maturity matrix allows the analyst to consider multiple dimensions of engagement and assess them together towards a single score for a strategy related to engagement with clients. |
5.3.7.3 LEN 7.3 Activities to influence clients with fossil fuel and/or deforestation-linked activities
| Description & Requirements | LEN 7.3 Activities to influence clients with fossil fuel and/or deforestation-linked activities |
|---|---|
| Short description of indicator | This indicator assesses the extent to which the financial institution implements activities and initiatives that help, influence or otherwise enable Oil & Gas client’s transition. The indicator aims to be a holistic measure of these activities and initiatives, with evidence of implementation and outcomes in the clients ‘value chain across all products/services. |
| Data requirements |
The relevant data for this indicator are:
External sources of data may also be used for the analysis of this indicator. |
| How the assessment will be done |
The assessment will assign a maturity score based on the financial institution’s demonstration of recent and current activities and initiatives with its clients operating in oil & gas sector and deforestation linked activities, expressed in a maturity matrix. A financial institution that is placed in the ‘Low-carbon aligned’ category will receive the maximum score. A financial institution which is at a lower level will receive a partial score, with 0 points awarded for having no engagement at all. This maturity matrix is indicative but does not show all possible options that can result in a particular score. The financial institution‘s responses will be scrutinized by the analyst and then placed on the level in the matrix where the analyst deems it most appropriate. 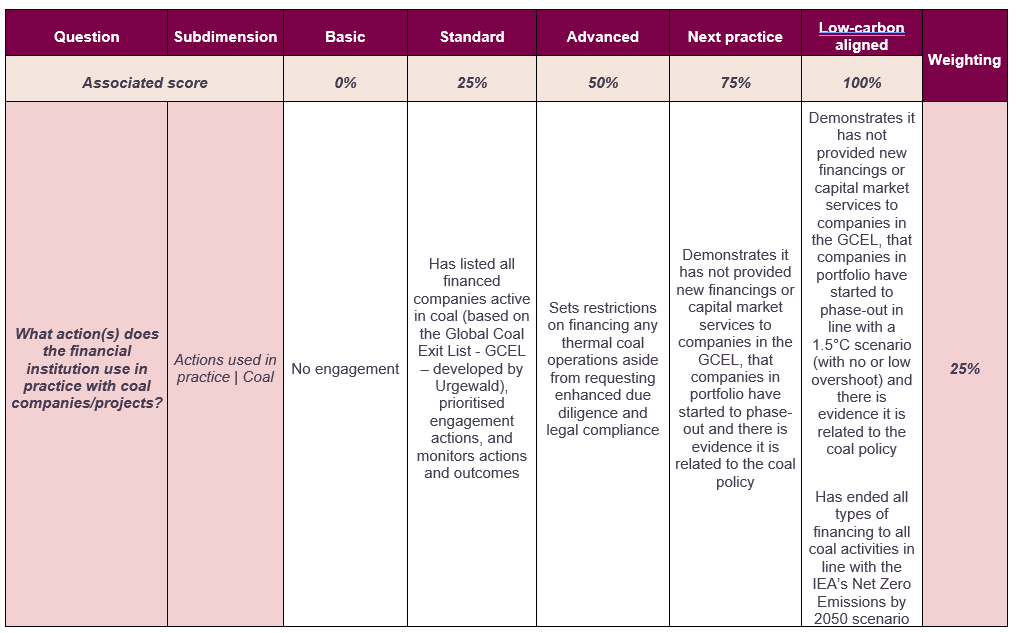 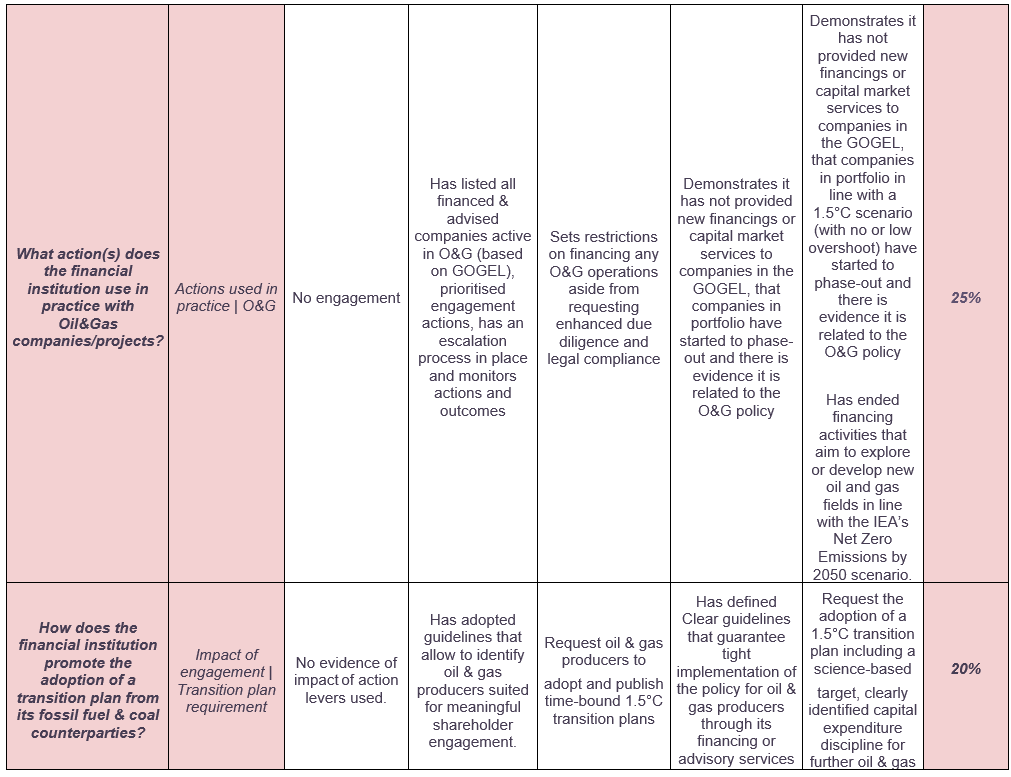 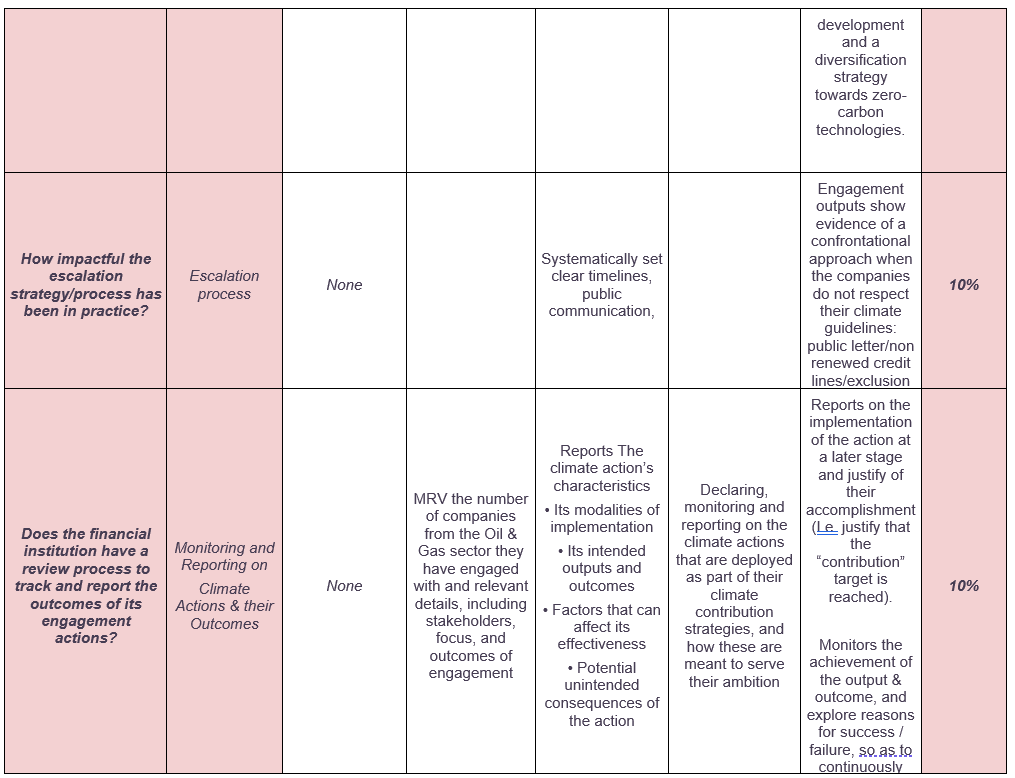 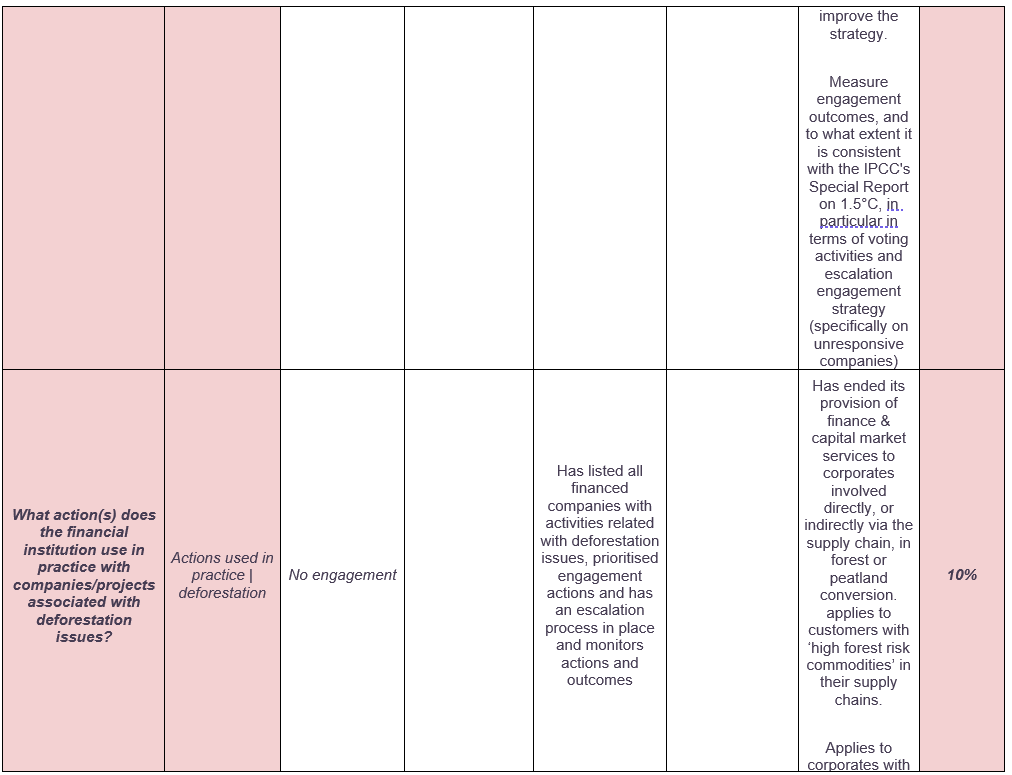 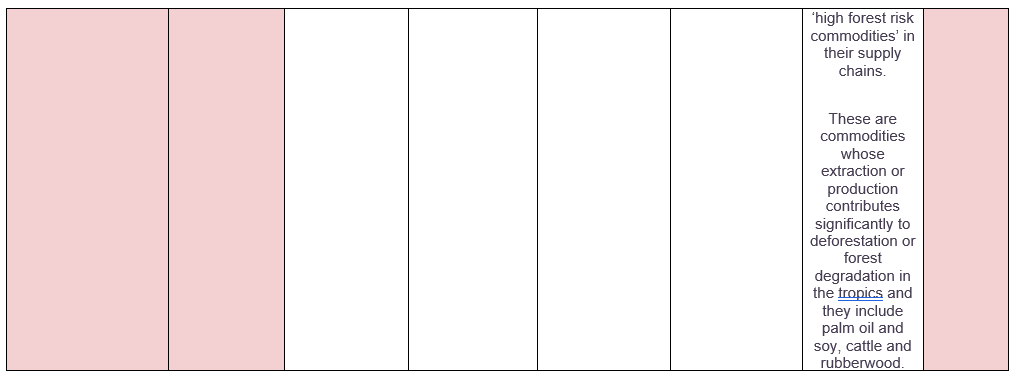 |
| Rationale | LEN 7.3 Activities to influence clients with fossil fuel and/or deforestation-linked activities |
| Rationale of the indicator |
Relevance of the indicator: Activities to influence Oil & Gas clients and deforestation-linked activities are included in this ACT methodology for the following reasons:
Scoring the indicator: Because of data availability and complexity, a direct measure of the outcome of such engagement is not very feasible at this time. It is often challenging to quantify the emission reduction potential and outcome of engagement activities. Therefore, the approach of a maturity matrix allows the analyst to consider multiple dimensions of engagement and assess them together towards a single score for all the activities related to Client Engagement for Oil & Gas sector and deforestation linked-activities. In the case where the financial institution has no exposition to Oil & Gas activities, nor through capital market activities, the tool will put more weight on the 7.1 and 7.2 indicators and 7.3 will account for 2% of total module 7 weighting, instead of 8%. 7.1 and 7/2 indicators weight will respectively be 7% and 11%. In the case where the financial institution has no exposition to deforestation linked activities, nor through capital market activities, the tool will put more weight on the 7.1 and 7.2 indicators and 7.3 will account for 6% of total module 7 weighting, instead of 8%. 7.1 and 7.2 indicators weight will respectively be 5% and 9%. |
5.3.8 Module 8: Policy engagement
The indicators in the Policy Engagement module are based on the “Investor expectations on corporate lobbying” guide (2018) developed by IIGCC and have adapted for financial institutions. Feel free to refer to the guide for additional context and rationale behind the indicators. This module assesses whether lobbying activities align with the Paris Agreement.
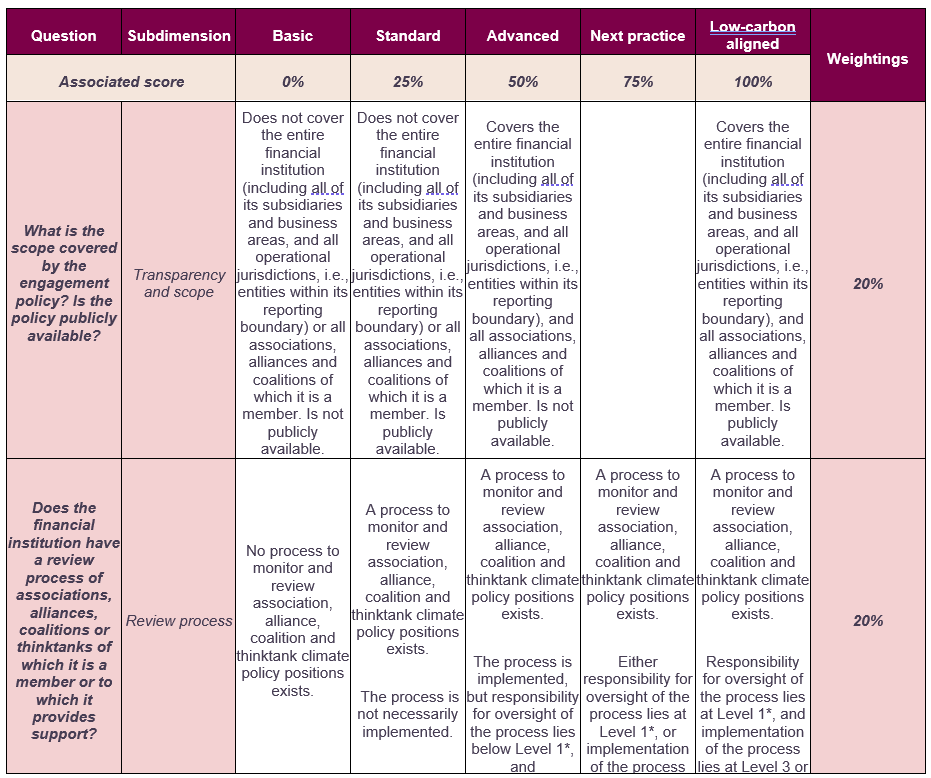
5.3.8.1 LEN 8.1 Financial institution policy on engagement with associations, alliances, coalitions or thinktanks
| Description & Requirements | LEN 8.1 Financial institution policy on engagement with associations, alliances, coalitions or thinktanks |
|---|---|
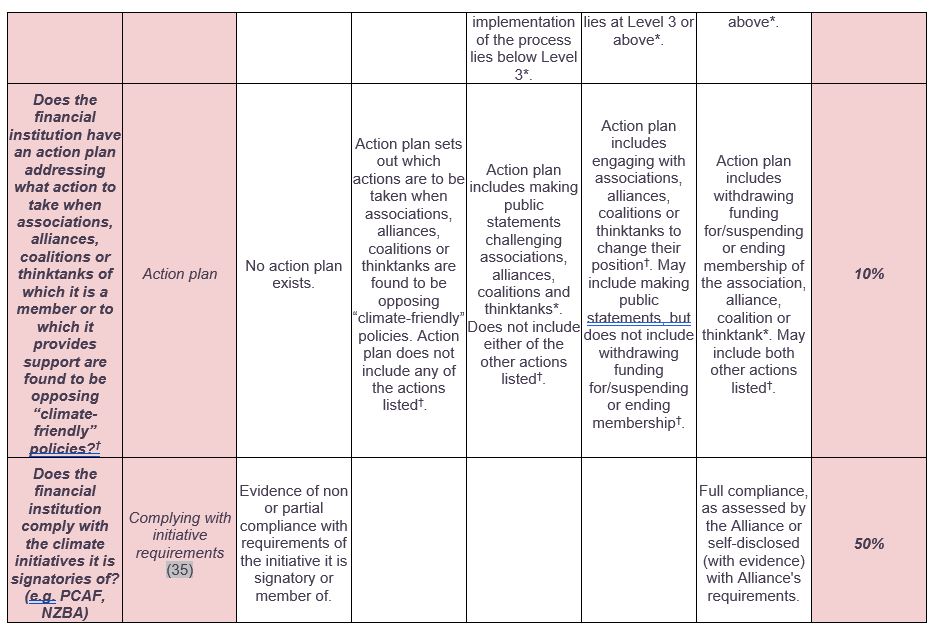
| Short description of indicator | The financial institution has a policy on what action to take when associations, alliances, coalitions or thinktanks of which it is a member or to which it provides support are found to be opposing “climate-friendly” policies. |
| Data requirements |
The relevant data for this indicator are:
CDP Questionnaire mapping to this indicator:
External sources of data may also be used for the analysis of this indicator. |
| How the assessment will be done |
The analyst will evaluate the description and evidence of the policy on trade associations and climate change for the presence of best practice elements and consistency with the other reported management indicators. The financial institution description and evidence will be compared to the maturity matrix developed to guide the scoring and a greater number of points will be allocated for elements indicating a higher level of maturity. Maximum points are awarded if all these elements are demonstrated. Best practice elements to be identified in the test/analysis include:
  Further guidance for each level of seniority is given below: Level 1
Level 2
Level 3
Level 4
Actions a financial institution can take when associations, alliances, coalitions or thinktanks of which it is a member or to which it provides support are found to be opposing “climate-friendly” policies follow a hierarchy of severity, as follows (source: (36), (37)):
|
| Rationale | LEN 8.1 Financial institution policy on engagement with associations, alliances, coalitions or thinktanks |
| Rationale of the indicator |
Associations, alliances, coalitions and thinktanks are a key instrument by which financial institution can indirectly influence policy on climate. Thus, when associations, alliances, coalitions and thinktanks take positions, which are negative for climate, financial institutions need to take action to ensure that this negative influence is countered or minimized. This indicator is consistent with the ACT Framework and ACT Guidelines and common to the other sectoral methodologies. Update has been made on the addition of a new category dealing with the compliance if the financial institution with the climate initiatives it is member or signatory of. To date, climate initiatives or alliances do have a lot of members and have active positions in favour of climate. Still, actions by the members themselves sometimes lag behind. The idea is to assess the potential greenwashing of some actors. |
5.3.8.2 LEN 8.2 Associations, alliances, coalitions and thinktanks supported do not have climate-negative activities or positions
| Description & Requirements | LEN 8.2 Associations, alliances, coalitions and thinktanks supported do not have climate-negative activities or positions |
|---|---|
| Short description of indicator | The financial institution is not on the Board of, providing funding beyond membership to, or otherwise supporting any associations, alliances, coalitions or thinktanks that have climate-negative activities or positions. |
| Data requirements |
The relevant data for this indicator are:
CDP Questionnaire mapping to this indicator:
External sources of data may also be used for the analysis of this indicator. |
| How the assessment will be done |
The list of associations, alliances, coalitions and thinktanks declared in the CDP data and other external sources relating to the company is assessed against a list of associations, alliances, coalitions and thinktanks that have climate-negative activities or positions (InfluenceMap is usually used for this (38)). (Consideration should be given as to whether these associations, alliances, coalitions and thinktanks in turn are members of or otherwise support other such organisations that have climate-negative activities or positions.) Such activities or positions could include lobbying against climate policies and practices. The results will be compared to any policy described in 8.1 (“Financial institution on engagement with associations, alliances, coalitions or thinktanks”). 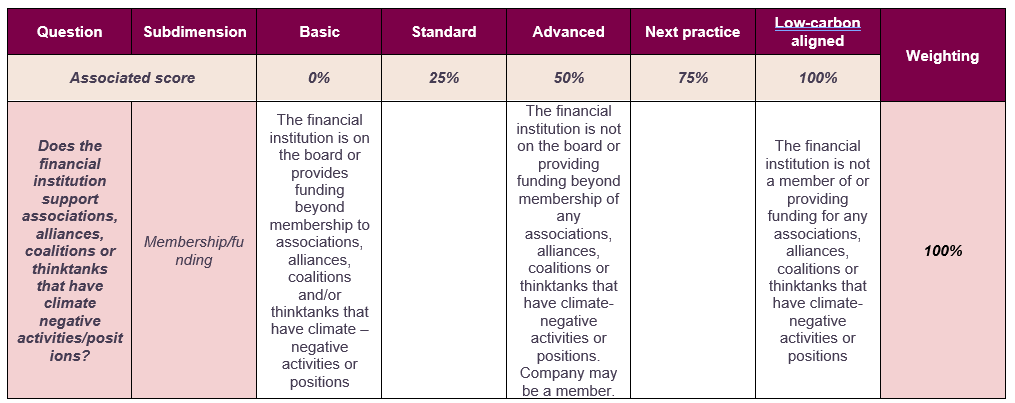 |
| Rationale | LEN 8.2 Associations, alliances, coalitions and thinktanks supported do not have climate-negative activities or positions |
| Rationale of the indicator | Associations, alliances, coalitions and thinktanks are key instruments by which financial institution can indirectly influence policy on climate. Thus, participating in associations, alliances, coalitions and thinktanks which actively lobby against climate-positive legislation is a negative indicator and likely to obstruct low-carbon transition. |
5.3.8.3 LEN 8.3 Position on significant climate policies
| Description & Requirements | LEN 8.3 Position on significant climate policies |
|---|---|
| Short description of indicator | The financial institution is not opposed to any significant climate relevant policy and/or supports climate-friendly policies. |
| Data requirements |
The relevant data for this indicator are:
CDP Questionnaire mapping to this indicator:
External sources of data shall also be used for the analysis of this indicator (e.g. RepRisk database, press news, actions in standard development) |
| How the assessment will be done |
The analyst evaluates the description and evidence on financial institution position on relevant climate policies for the presence of best practice elements, negative indicators and consistency with the other reported management indicators. The financial institution description and evidence will be compared to the maturity matrix developed to guide the scoring and a greater number of points will be allocated for elements indicating a higher level of maturity. 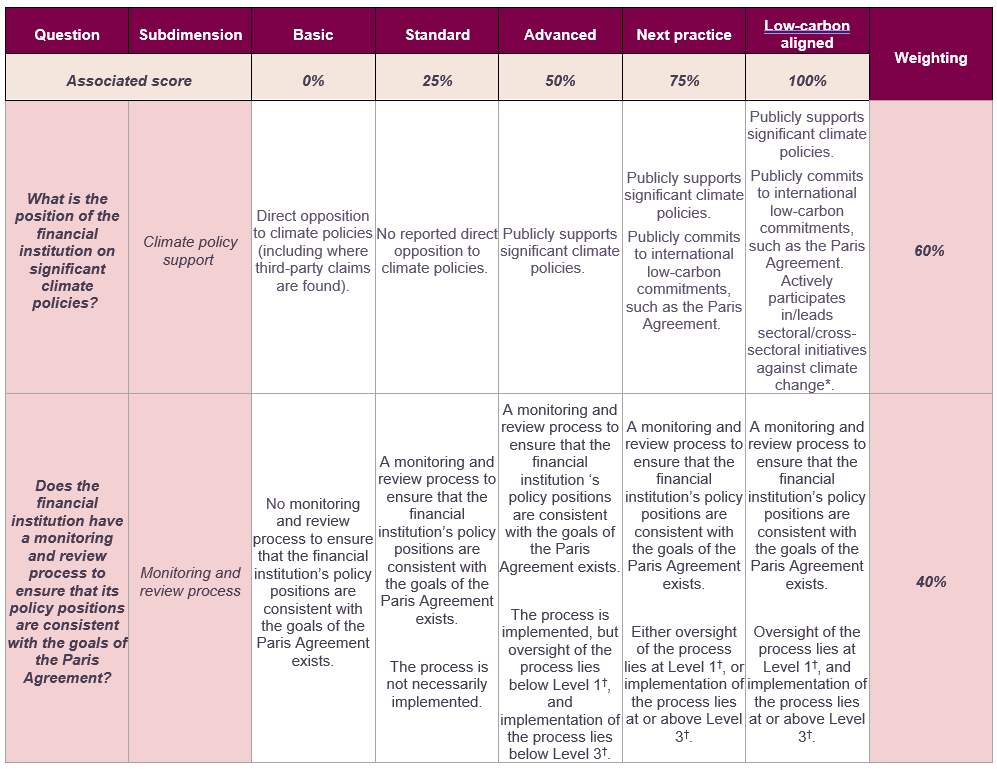
Examples of sectoral/cross-sectoral initiatives against climate change might include, but are not limited to:
Further guidance for each level of seniority is given below: Level 1
Level 2
Level 3
Level 4
|
| Rationale | LEN 8.3 Position on significant climate policies |
| Rationale of the indicator | Policy and regulation that acts to promote transition to a low-carbon economy is key to the success of the transition. Financial institutions should not oppose effective and well-designed regulations in these areas but should support them. |
5.3.8.4 LEN 8.4 Collaboration with local public authorities
| Description & Requirements | LEN 8.4 Collaboration with local public authorities | |
|---|---|---|
| Short description of indicator | This indicator evaluates the extent to which the financial institution collaborates with local public authorities to achieve local emissions reductions. While indicator 8.3 “Position on significant climate policies” relates to national and international policies, this indicator assesses the financial institution’s engagement with sub-national public authorities, both in terms of climate-related policy engagement and the establishment of climate-related partnerships. | |
| Data requirements |
The relevant data for this indicator are:
CDP Questionnaire mapping to this indicator:
External sources of data shall also be used for the analysis of this indicator. |
|
| How the assessment will be done |
The analyst evaluates the description and evidence of the financial institution’s collaboration with local authorities for the presence of best-practice elements. Collaboration generally falls into two main categories, policy engagement and collective action/partnerships. Policy engagement could range from dialogue between the financial institution and local authority around the development of new climate-related policies, to participation in local pilot programs to finance these policies, to large-scale support for and implementation of these policies. Collective action/partnerships could range from participation in working groups, roundtables, ongoing initiatives, events and/or platforms for local authorities and companies to advance specific issues related to climate change/emissions reduction, to large-scale public-private partnerships (PPPs) with a climate change/emissions reduction focus. In general, a partnership can only be classed as such if it goes beyond a mere contract between the public authority and the financial institution. It must be a collaboration that works to improve the current system/process and displays additionality (the collaboration reduces GHG emissions beyond business as usual, meaning the reductions would not have happened had the collaboration not been implemented). For example, a contract between a transport operator and a public authority would not be enough to be classed as a partnership by itself, whereas a partnership to reduce local GHG emissions by increasing the share of electric/hybrid/hydrogen buses and promoting greater uptake of public transport within the local area would be sufficient. While the thematic areas of these collaborations will vary depending on the sector assessed, they should generally fall into one or more of four broad categories:
In each case, the level of maturity will depend on the level of commitment from the financial institution, and whether there is evidence that the collaboration has been successful in achieving local emissions reductions. The financial institution description and evidence are compared to the maturity matrix developed to guide the scoring and a greater number of points are allocated for elements indicating a higher level of maturity. 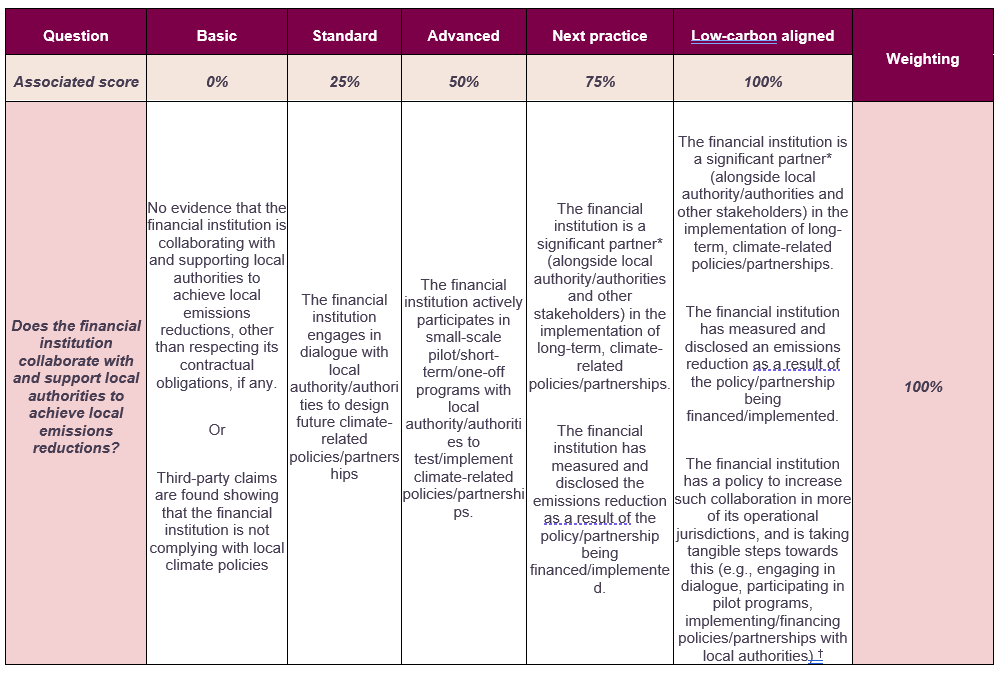 A financial institution can be classed as a “significant partner” if the policy/partnership would not exist, or be significantly smaller/less successful, without the financial institution’s involvement/financings. The financial institution must be one of the few largest or most invested stakeholders in the policy/partnership. Analysts should consider the size of the financial institution assessed. For example, financial institution operating in a single jurisdiction are not expected to be involved in collaboration with public authorities outside of that jurisdiction, and could still score Low-carbon aligned if they met each of the other criteria (for example, if they had demonstrated emissions reductions as a result of the policy/partnership being implemented/financed, and had a policy to become involved in more collaboration within their operational jurisdiction). |
|
| Rationale | LEN 8.4 Collaboration with local public authorities | |
| Rationale of the indicator | Collaboration with local authorities can be a key instrument by which financial institution can indirectly influence policy on climate in their territory. Thus, participating actively in local dialogues shows leadership in climate actions and can significantly help climate policies enforcement. | |
5.3.9 Module 9: Business model
A financial institution may transition its business activities to other areas to remain profitable in a low-carbon economy. The financial institution’s future business model should enable it to decouple financial results from GHG emissions, in order to help companies meet the constraints of a low-carbon transition while continuing to generate value. This can be done by developing activities outside the core business of the financial institution.
This module will aim to assess whether financial institutions demonstrate the inclusion of criteria of analysis in their appraisal of economic value. New standard of credit risk analysis shall also be assessed and rewarded in this module.
This module aims to identify both relevant current business activities and those still at a burgeoning stage. It is recognised that transition to a low-carbon economy, with the associated change in business models required to companies, will take place over a number of years. The analysis will thus seek to identify and reward project financings at an early stage as well as more mature business activity financings, although the latter (i.e. substantially sized, profitable, and/or expanding) business activities will be better rewarded.
The present module has been driven notably by the following considerations:
- Focus on new business activities (climate solutions)
- High emissive / involved in high emissive activity companies should be benchmarked by quantitative modules (not in business model module)
- Score will be based on long-term viability of the financial institution’s financings towards business activities compatible with/contributing to a the low-carbon economy
- Do the financings help to bridge the climate finance gap?
- Is there a need to change the fundamental business activities? e.g. no longer provide financings to fossil fuel companies or provide bonified loan to green project or transitioning companies or penalize high emissive companies.
- How does the emissive activities/sectors link with the financings?
- Financing new business models vs. transitioning existing business model
We shouldn’t penalize financial institutions who can’t shift their financings as they are not financing high emitting sectors
5.3.9.1 LEN 9.1 Tools/policy facilitating channelling credits to the transition towards a low carbon economy
| Description & Requirements | LEN 9.1 Tools/policy facilitating channelling credits to the transition towards a low carbon economy |
|---|---|
| Short description of indicator | The financial institution is actively developing internal tools and implementing policy enabling to foster low carbon economy financing. It is demonstrating the application of tools & policies through its portfolio mix composition, its loan granting process, or capital market services. The innovative tools are used in key strategic sectors (high emissive or green) and make it possible for the financial institution to boost its contribution to low carbon economy financing. |
| Data requirement |
The relevant data for this indicator are:
CDP Questionnaire mapping to this indicator:
External sources of data may also be used for the analysis of this indicator. |
| How the assessment will be done |
The analysis is based on the financial institution tools or policies degree of integration in its business activities. The analyst must assess the operational levers put in place to better support activities and companies in their transition. The analysis is based on (up to) five tool or policy categories proposed by the financial institution. The analyst evaluates the business model shift through a maturity matrix. If several tools or policies are accountable to this section, the final score will be the one given to the most mature activity (usually the one that is best scored too). The financial institution should not be penalized if it has built a mature business model and explores besides other tracks (which would be scored with a lower score) compared to another financial institution having only one mature business model. Relevant activity areas for this indicator include:
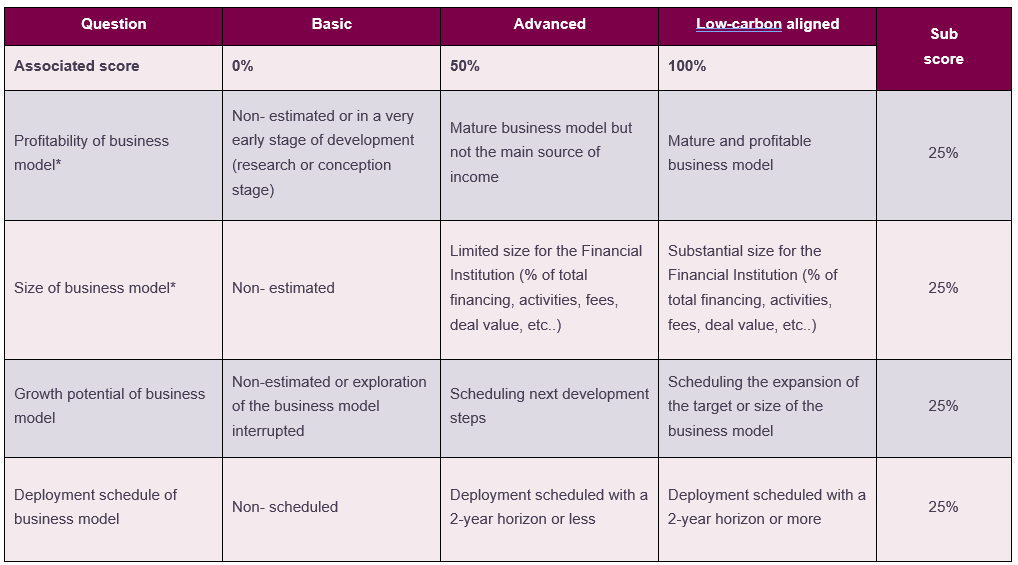 * Example: a 12% of Total revenue from green loans gives a 50% score for Profitability of financing activity which means ‘Mature business activity but not the main source of income or in a development stage (e.g. test)’ 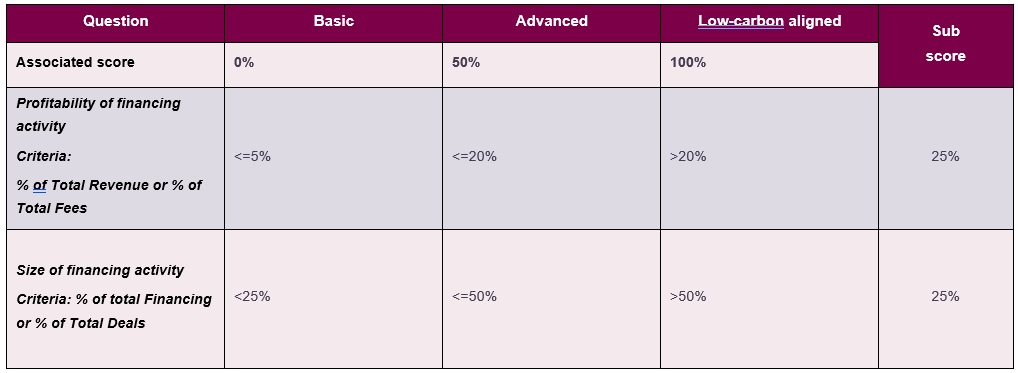
|
| Rationale | LEN 9.1 Tools/policy facilitating channelling credits to the transition towards a low carbon economy |
| Rationale of the indicator | The financial institution is developing tools and implementing policies that can help modify and drive their financings in favour of a low carbon economy. All financial institutions are guided by the balance between yield & risk. Enhancing policy or tool that can influence one of these two categories can be a game changer. All banks should for instance integrate climate risks into the credit risk analysis, and, as a result, score, whether before granting the loan, but also when conducting the credit risk analysis review during the loan period. Banks should set internal tools, inspired by existing best practices or anticipate future regulation (e.g. current discussion of the revision of the Capital Requirements Directive (CRD) (40)) in order to update their approach in the context of climate change contribution needs and related risks (popularized for almost a decade now (41) now and even spotted before (e.g. Andrew Dugolecki in 2005). |
5.3.9.2 LEN 9.2 Financial flows reorientation towards (i) aligned or (ii) transitional entities or activities or (iii) climate change solutions
| Description & Requirements | LEN 9.2 Financial flows reorientation towards (i) aligned or (ii) transitional entities or activities or (iii) climate change solutions |
|---|---|
| Short description of indicator |
This indicator measures the financial institution contribution through the share of its financings towards (i) aligned or (ii) transitional entities or activities or (iii) climate change solutions versus the total outstanding loan amount. The goal is to capture the share of low-carbon activities/companies financed and its growth potential. Low-carbon activities or associated financial products are defined according to the EU Green taxonomy. |
| How the assessment will be done |
Best practice elements to be identified in the test/analysis include:
CDP Questionnaire mapping to this indicator:
The analysis is based on (up to) five financing activities towards (i) aligned entities or activities, (ii) transitional or (iii) climate change solutions proposed by the financial institution. The analyst evaluates the business activities shift through a maturity matrix. If several financing activities for transition are accountable to this section, the final score will be the one given to the most mature financing activity (usually the one that is best scored too). The financial institution should not be penalized if it has built a mature business model and explores besides other tracks (which would be scored with a lower score) compared to another company having only one mature business model. Best practice elements to be identified in the test/analysis include:
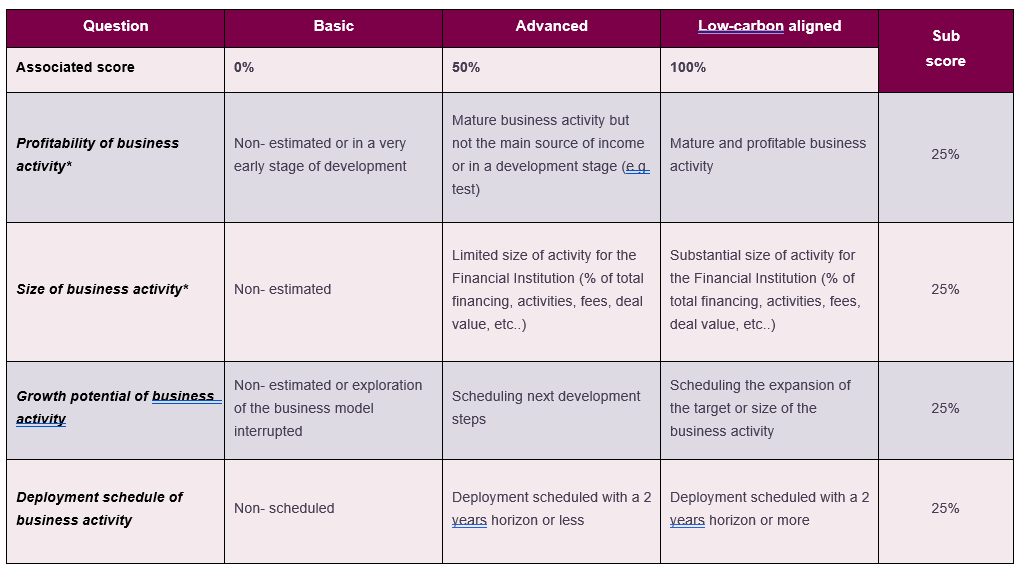 * To score the ‘Profitability of financing activity’ and ‘Size of financing activity’ categories, the analyst shall refer to the following matrix: |
| Rationale |
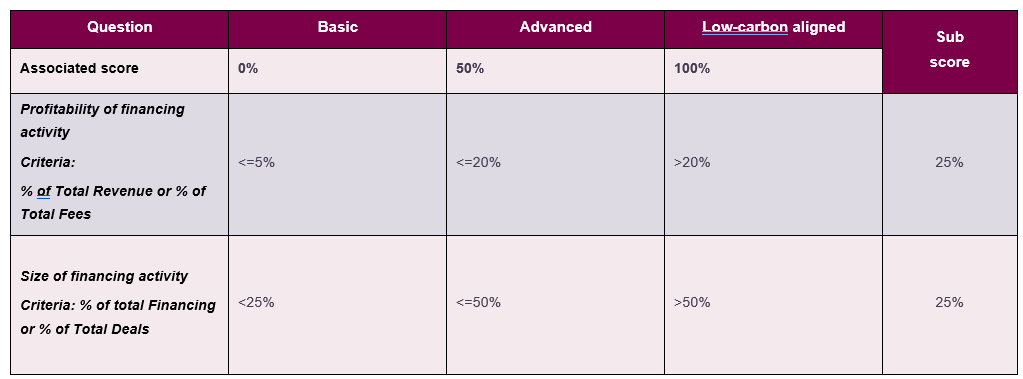 Example: a 12% of Total revenue from green loans gives a 50% score for Profitability of financing activity which means ‘Mature business activity but not the main source of income or in a development stage (e.g. test)’
|
| Rationale of the indicator |
This indicator is for financial institution financing emissive activities or companies (e.g. companies operating on emissive value chain, upstream of an intensive activity, supplying part of the final product (e.g. transport equipment manufacturer)). A financial institution that finances part of a highly emitting final product bears some responsibility for the emissions linked to this product but is also at risk in a low carbon world. This indicator aims to capture the evolution of a financial institution's loan mix towards low-carbon activities and companies. For example, a bank granting a loan to a company that produces equipment for the automotive sector can help increase its share of products for electric vehicles, thus contributing to the promotion of low-carbon vehicles and reducing its risk linked to thermal vehicles in a low-carbon world. There is still a huge gap of financing in climate solutions and financial institution have the power to bridge part of this gap (along with other actors). Banks must align their business practices with Paris Agreement mitigation goal and contribute reducing GHG emissions in the real economy. |
6 Assessment
6.1 Sectoral Benchmarks
6.1.1 Description of the benchmarks
The fundamental target to achieve for all organizations is to contribute to not exceeding a threshold of 2⁰C global warming compared to pre-industrial temperatures. This target has long been widely accepted as a credible threshold for achieving a reasonable likelihood of avoiding climate instability, while a 1.5⁰C rise has been agreed upon as an aspirational target.
Therefore, low carbon scenarios used for the benchmarks are Well Below 2°C scenarios or 1.5°C scenarios.
Every financial institution sectoral financed emission shall be benchmarked according to an acceptable and credible benchmark that aligns with spatial boundary of the methodologies.
6.1.2 Mechanisms to compute the sectoral financial institution benchmark
The sectoral financial institution benchmark is the financial institution sectoral allocated decarbonization pathway. The financial institution is allocated this pathway from the sector decarbonization pathway, of which there are different pathways for different countries and regions. The extent to which a financed company is tied to a scenario in any one country is proportional to its sales in that country, thus the financial institution sectoral benchmark is geographically weighted.
Two types of benchmarks will be used depending on the type of sectors.
The first type of benchmark is a convergence approach for homogeneous sectors (e.g. cement, electric utilities). The allocation mechanism is taken from the sectoral decarbonization approach (SDA (11)) to science-based targets.
The allocation mechanism, as defined by the SDA (see Glossary), is the convergence mechanism. This allocation takes the financial institution’s sectoral financed intensity emissions in the base year and converges it to the related sector’s emissions intensity in 2050. Thus, sectoral financed emissions starting from a lower intensity will have a shallower decarbonisation pathway than sectoral financed emissions starting from a higher intensity. In this way, past action or in-action to reduce intensity is incorporated.
The second type of benchmark is the absolute contraction method from SBTi. It is used for heterogeneous sectors (Agri & Agro, Chemicals).
Benchmarks to be updated with an IEA NZE benchmark where possible by March 2023 (before road-testing). This table and the associated tool will be updated.
| Target type | Metric | Mechanisms |
|---|---|---|
| Agriculture & Agrifood (Sectoral financed emissions) | % of absolute emissions’ reduction | - SBT Absolute Contraction Approach (ACA) |
|
Scope 3.15 - Intensity Aluminium (Sectoral financed emissions) |
tCO2e/ton | - SBT Sectoral Decarbonization Approach (SDA) |
|
Scope 3.15 - Intensity Automotive (Sectoral financed emissions) |
gCO2e/p.km | - SBT SDA |
|
Scope 3.15 - Intensity Building (Sectoral financed emissions) |
kgCO2e/m2 | - SBT SDA |
|
Scope 3.15 - Intensity Cement (Sectoral financed emissions) |
tCO2e/ton | - SBT SDA |
|
Scope 3.15 - Absolute Chemicals (Sectoral financed emissions) |
% of absolute emissions’ reduction | - SBT ACA |
|
Scope 3.15 - Intensity Electric Utilities (Sectoral financed emissions) |
kgCO2e/kwh | - SBT SDA |
|
Scope 3.15 - Intensity Glass (Sectoral financed emissions) |
tCO2e/ton | - SBT SDA |
|
Scope 3.15 - Intensity Iron & Steel (Sectoral financed emissions) |
kgCO2e/ton | - SBT SDA |
|
Scope 3.15 - Intensity Oil & Gas (Sectoral financed emissions) |
tCO2e/TJ | - SBT SDA |
|
Scope 3.15 - Intensity Pulp & Paper (Sectoral) |
tCO2e/t | - SBT SDA |
|
Scope 3.15 - Intensity Real Estate (Sectoral financed emissions) |
kgCO2e/m2 | - SBT SDA |
|
Scope 3.15 - Intensity Transport (Sectoral financed emissions) |
gCO2e/p.km gCO2e/t/km |
- SBT SDA |
|
Scope 3.15 - Intensity Asset Class (Sectoral financed emissions) |
- Intensity metric related to the sector the asset class is tied (see above) | - SBT SDA |
|
Scope 3.15 - Absolute Asset Class (Asset class financed emissions) |
% of absolute emissions’ reduction | - SBT ACA |
|
Scope 3.15 - Absolute General (Global Financed emissions) |
% of absolute emissions’ reduction | - SBT ACA |
6.1.3 Reference pathways classification
A reference pathway defines the carbon intensity (tCO2/activity) pathway for homogeneous sectors or the carbon absolute emissions (tCO2) trajectory for heterogeneous sectors (e.g. Chemicals).
In order to allocate decarbonization pathway to the financial institution, two options were decided with the technical working group:
- Use the Sectoral Decarbonization Approach (SDA) of the Science Based Target initiative (SBTi) (42) when targets are tied to sectors (and when applicable to the sectors (i.e. homogenous sectors such as Cement, Real Estate, Electric Utilities)).
- Use an existing generic method such as the Absolute Contraction Approach (ACA) of the Science Based Target initiative (SBTi) for targets not referring to a sector (absolute asset class targets) and/or being global (absolute portfolio targets).
6.1.4 Available reference pathways
| Target type | Metric | Benchmarks (4) |
|---|---|---|
| Agriculture & Agrifood (Sectoral financed emissions) | % of absolute emissions’ reduction | - 1.5°C IEA Scenario |
|
Scope 3.15 - Intensity Aluminium (Sectoral financed emissions) |
tCO2e/ton | - IEA ETP 2020 - SDS |
|
Scope 3.15 - Intensity Automotive (Sectoral financed emissions) |
gCO2e/p.km | - IEA ETP 2017 - B2DS |
|
Scope 3.15 - Intensity Building (Sectoral financed emissions) |
kgCO2e/m2 | - IEA ETP 2017 - B2DS |
|
Scope 3.15 - Intensity Cement (Sectoral financed emissions) |
tCO2e/ton | - IEA 2017 B2DS |
|
Scope 3.15 - Absolute Chemicals (Sectoral financed emissions) |
% of absolute emissions’ reduction | - 1.5°C IEA scenario |
|
Scope 3.15 - Intensity Electric Utilities (Sectoral financed emissions) |
kgCO2e/kwh |
- SBT SDA - IEA ETP 2017 – B2DS |
|
Scope 3.15 - Intensity Glass (Sectoral financed emissions) |
tCO2e/ton | - IEA ETP 2020 - SDS |
|
Scope 3.15 - Intensity Iron & Steel (Sectoral financed emissions) |
kgCO2e/ton | - IEA ETP 2020 - SDS |
|
Scope 3.15 - Intensity Oil & Gas (Sectoral financed emissions) |
tCO2e/TJ | - IEA NZE 2021 |
|
Scope 3.15 - Intensity Pulp & Paper (Sectoral) |
tCO2e/t | - IEA ETP 2020 - SDS |
|
Scope 3.15 - Intensity Real Estate (Sectoral financed emissions) |
kgCO2e/m2 | - IEA ETP 2017 B2DS |
|
Scope 3.15 - Intensity Transport (Sectoral financed emissions) |
gCO2e/p.km gCO2e/t/km |
- IEA ETP 2017 B2DS |
|
Scope 3.15 - Intensity Asset Class (Sectoral financed emissions) |
- Intensity metric related to the sector the asset class is tied5 | - 1.5°C IEA scenario |
|
Scope 3.15 - Absolute Asset Class (Asset class financed emissions) |
% of absolute emissions’ reduction | - 1.5°C IEA scenario |
|
Scope 3.15 - Absolute General (Global Financed emissions) |
% of absolute emissions’ reduction | - 1.5°C IEA scenario |
Benchmarks to be updated with an IEA NZE benchmark where possible by March 2023 (before road-testing). This table and the associated tool will be updated.
The scenarios used in the tool are coming from the IEA. Still, one can use other scenarios if preferred (for instance OECM (43)). The scenarios used here come from the IEA ETP of 2017, 2020 or NZE 2021.
IMPORTANT: scenarios referenced in the table above have not been updated with the most recent scientific scenarios available on all sectors for methodological reasons. An update of the mentioned scenarios will be done before the road-test where relevant. Problem with NZE benchmark is the low geographical granularity on some sectors while it is known that decarbonization efforts will be different between developed countries (higher decarbonization rate) than EMDE ones (lower decarbonization rate).
If the ACT Team chooses not to update the tool with all IEA NZE benchmarks for sectoral reason, It will not be a problem at the financial institution level as the non-harmonization of scenarios are at the advantage of the financial institution since scenarios dating back 2017 or 2020 do not take into account the carbon budget that have already been consumed until today. Basically, if the commitment gap of the financial institution on these sectors is high, it will mean that the financial institution sectoral targets are very far from where it should be as most recent scenarios are even more demanding in terms of carbon GHG emission reduction. The challenge would be about the comparison between financial institutions as it will be possible in 2023 to benchmark financial institutions among the road-test sample. Reason is that financial institution exposed to certain sectors could be advantaged or penalized given the date and ambition of the benchmark (e.g. ETP 2017 vs NZE 2021).
In sum, please keep in mind that background scenarios will be updated.
6.2 Weightings
A. Commercial and Retail banks (lending activities to corporates and/or consumers)
B. Commercial and Retails banks (idem) + capital market activities (equity and bonds underwriting)
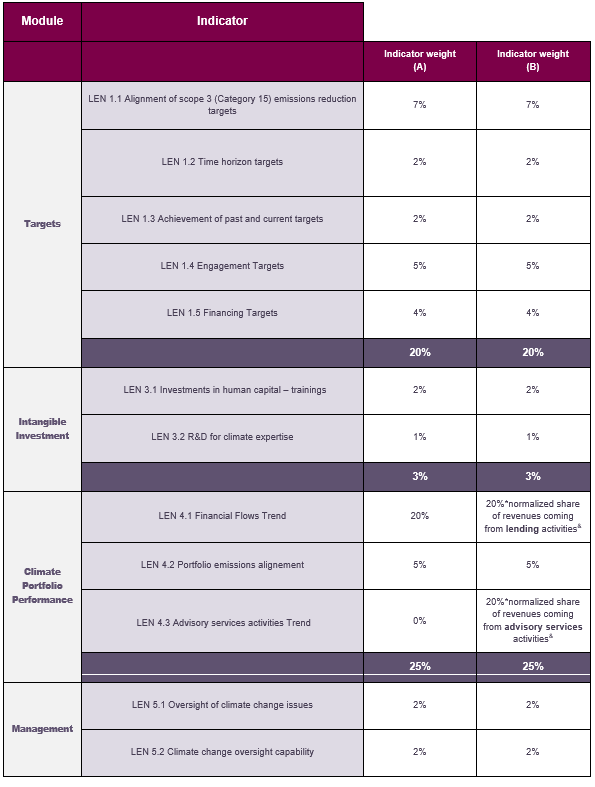
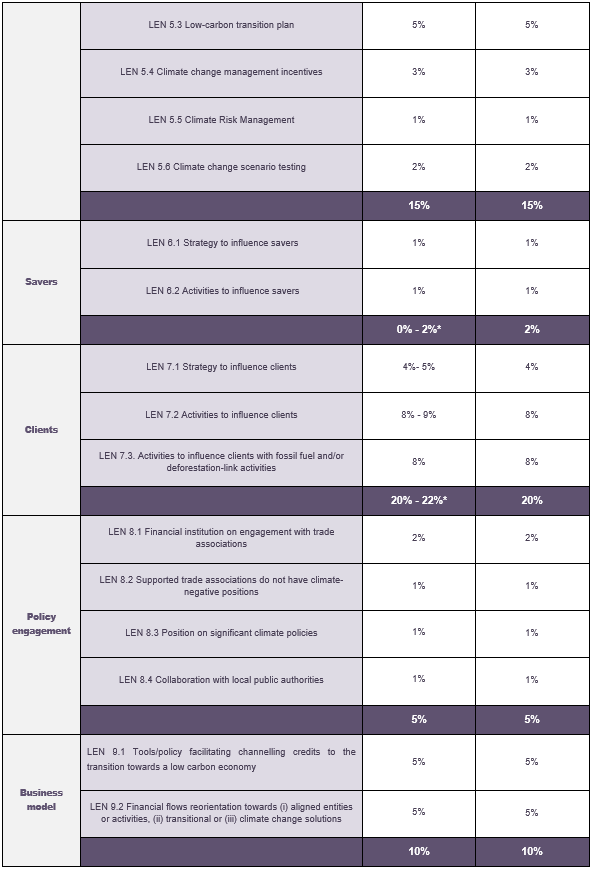

* weighting variation depending on the existence of saving deposits (2%) or not (0%). If there is no saving deposit then these 2% have been allocated to the module 7. Clients engagement (1% for 7.1 and 1% for 7.2).
& the sum of normalized share of revenues coming from lending and advisory services activities is of 100%, thus global sum of the weights of the module is always equal to 25%.
As an example, if global revenues is 110, including 80 for lending, 20 for advisory services and 10 others, normalized shares of lending and advisory services will be respectively of 80% and 20%. The weight attributed to LEN 4.1 will be 20%*80%=16% and to LEN 4.3 20%*20% = 4%.
Rationale for weightings
The selection of weights for both the modules and the individual indicators was guided by a set of principles (see the ACT framework document for more information). These principles helped define the weighting scheme of the modules and indicators.
| Principle | Explanation |
|---|---|
| Value of information | The value of the information that an indicator gives about a financial institution’s outlook for the low-carbon transition is the primary principle for the selection of the weights. |
| Impact of variation | A high impact of variation in an indicator means that not performing in such an indicator has a large impact on the success of a low-carbon transition, and this makes it more relevant for the assessment. |
| Future orientation | Indicators that measure the future, or a proxy for the future, are more relevant for the ACT assessment than past & present indicators, which serve only to inform about the likelihood and credibility of the transition. |
| Data quality sensitivity | Indicators that are highly sensitive to expected data quality variations are not recommended for a high weight compared to other indicators, unless there is no other way to measure a particular dimension of the transition. |
The weightings have been designed for two types of financial institutions covered in this ACT 4 Finance methodology in order to reflect the strategic stakes which are different from a bank to another.
Targets 20%
Represents an important part of the performance score as it counts for 20%. Target-setting is the first key step in the journey to Net Zero. It is a key milestone in the climate strategy of a financial institution as it gives the path to follow regarding the companies and sectors to finance in their decarbonization journey.
We assess:
GHG emissions targets. We will assess the commitment gap of the Financial Institution between their objectives and sectoral/global science-based scenarios (IEA ETP 2017 (to be updated by NZ IEA 2050) or OECM pathways). We will use the SDA/ACA target setting method in the different categories (Global, Sectoral and/or Asset class). The latter do not have the same weightings as we want to reward sectoral and asset class target setting approaches (please refer to the module ‘Scoring’ to have an overview of the weighting breakdown). The module also contains metrics that assess the current degree of completion of the targets set. Thus, it provides a great picture of the current financial institution performance on its financed emissions reduction. As this methodology is looking to assess contribution, it not a sufficient robust approach to assess the climate performance of a financial institution: portfolio can decarbonize by reallocation while not leading to GHG reduction in the real economy. This why this it includes non-GHG based targets on fossil fuels sectors, deforestation, companies with a transition and climate solution financing (as there is still a huge financing gap to bridge).
Non GHG emissions targets. Assessing the engagement & financing targets in order to capture the objectives of the financial institution in terms of contribution to the transition (the present performance on these topics will also be assessed in either Climate performance module (#4), Investees engagement (#7) and/or Business model (#9)). We have been including the engagement targets on Oil & Gas and Coal as we consider it to be a first/priority approach as a credible net-zero aligned strategy. Capturing sectoral targets on Fossil Fuels and deforestation are quite an innovative update as it was not existing in the previous methodologies. As mentioned in the document, it is not possible to have a robust and credible transition plan without an explicit, transparent and scientific aligned targets (i.e. exit and exclusion strategy) on these sectors.
These non GHG emission-based targets are qualitative, meaning that we have created categories of best practices level based on scientific recommendations.
Material Investment 0%
This module assesses the current and projected emissions associated with scope 1 and scope 2 emissions. This is the reason why it is not a relevant module for this methodology. The emissions associated with the financings are much higher and key for this sector. The ACT methodology follow the recommendations of the ISO 14064-1 in terms of boundary applicable to GHG reporting: all direct and indirect significant emissions must be reported. Emissions from scope 1 and scope 2 do not represent significant emissions of a financial institution (7).
Intangible Investment 3%
Banks must raise their climate capabilities, both for better understanding the climate risk and financial flows reorientation and being able to support companies on how to best transition, in order for banks’ lending portfolio to meet their commitments.
Better structuring loans with climate consideration demands a specific knowledge that need to be acquired.
The weight is quite low notably because these intangible investments in human capital are quite difficult to quantify and evaluate.
Portfolio Climate Performance 25%
This module represents 25% of the assessment as it the core performance module of the tool.
Our approach in this ‘Climate Performance Module’ is that we are not assessing the GHG emissions of the Financial Institution tied to its counterparties/activities financed. What we want to measure is the contribution of the financial institution to financing the decarbonization of the economy. Currently, a 1.5°C aligned portfolio has a low real economy impact: it means that it finances pure-players/climate best in class companies and/or taxonomic activities while the main challenge is to finance the transition of high emitting sectors’ companies. Conversely, a portfolio with high financed emissions but proving to help high emitting sectors decarbonize has more impact in GHG emission in the real economy.
As so, we assess whether the financial institution is financing (i) companies with a transition plan or not (for General corporate purpose instruments) and (ii) enabling/transitional/aligned activities or not (for Use of Proceeds instruments). We capture the evolution of these financing amounts (by sector) from ‘Reporting Year’ minus 3 years.(Indicator 4.1)
This indicator is completed by a maturity matrix. Given the heterogeneity in terms of portfolio alignment metrics and outputs, it has been out of reach to draft a unique way of assessing the portfolio alignment of a financial institution. Relevant tools exist today but always have bias preventing from benchmarking financial institution’s portfolio alignment from another. It aims to capture the relevancy of the portfolio alignment exercise done by the Financial Institution. This exercise must be conducted in order to identify the companies to engage with. Basically, this exercise should lead to an engagement action plan. This is what we assess in this second indicator (4.2), notably through different categories: Desired outcomes of the exercise, Disclosure & Transparency, Metrics usefulness (among other).
Our approach is more impact driven (flow & engagement) than transition risk driven (pure GHG emissions focus).
Management 15%
Management is a multi-faceted module that makes up 15% of the score, because it incorporates many different smaller indicators that together paint a picture of the financial institution’s management and strategic approach to the low-carbon transition. Some weight is placed on the oversight of climate change issues and the climate change oversight capability, which are weighted 2%. These two indicators measure the ability of the financial institution to integrate sustainability to its strategy and to embrace the main challenges related to low-carbon transition. Besides, according to the principle of future orientation, the transition plan provides more information on how this company will specifically deal with the transition, and has a weight of 5%.
The remaining indicators (climate change management incentives, Climate Risk Management and climate change scenario testing) have a weight of 3%, 1% and 2% as they can either strengthen or undermine the financial institution’s ability to carry out the transition plan and meet ambitious science-based targets. Given the specificity of the finance actor, the Climate change management incentives have been updated to 3% as if all front office employees have a direct remuneration with climate deals, it demonstrates the operational declination of the climate strategy.
Savers engagement 0 - 2%
To decarbonize the whole economy, it is essential that all stakeholders get involved. Deposits are a key financial resource for many credit institutions. The deposit relationship, whether with a corporate or a retail (consumer) saver, is often one entry point for the institution in order to provide other product and services. Given the proximity of some retail banks with corporates and/or consumers, a real dialogue on climate and transition can happen and trigger changes. Depending on the size of deposits compared to the balance sheet of the financial institution, the module will apply or not. In the latter case, the associated weighting (2%) is repercussed to the following module.
Clients engagement 20%-22%
This module represents 20% (22% if the Saver’s engagement module does not apply, see above) as engagement with counterparties is essential for boosting GHG emissions reduction in the real economy. After having reoriented part of its financial flows (module 4) the financial institution must also take actions with the counterparties it finances in order to help them decarbonize. As a money provider, it has important responsibility for the consequence of the GHG emissions it unlocked. Various levers exist. The idea is to assess the robustness of the engagement framework and to understand whether the engagement strategy is tied to an impact management system standardize or if it follows in internal theory of change, leading to the possibility of defining by its own what is impactful or not.
Policy engagement 5%
In line with the rationale for the management indicators of low weight, the policy engagement indicators are also contextual aspects which tell a narrative about the financial institution’s stance on climate change and how the financial institution expresses their engagement with policy makers and trade associations.
Business model 10%
The module captures many elements and aspects that cannot otherwise be captured in any of the other modules. It includes those aspects that are important to trigger a change in the business activities of a financial institution. It is future oriented by asking the financial institution on its narrative on certain future directions it can/has to take to enable the transition.
6.3 Data request
Table 1Table 18 introduces the list of information that will be requested to financial institutions through a questionnaire, as well as the corresponding indicators.
| Module | Indicators | Data request |
|---|---|---|
| 1 - Targets | 1.1 | Emissions (in absolute or physical intensity) at reporting year, at year the target was set, its reduction target, the credit exposure, the target credit exposure, the target GHG coverage, and other information if necessary (geography, …) |
| Reduction targets in sectoral intensity approach | ||
| 1.2 | A comparison of: (a) the longest time horizon of the financial institution sectoral targets, and (b) the long-term point fixed by ACT assessment methodology. | |
| The financial institution has interval (<=5years) targets that ensure both short and long-term targets are in place to incentivize short-term action and communicate long-term commitments. | ||
| 1.3 | Base year | |
| Reporting year | ||
| Target year | ||
| Percentage of reduction target from base year in absolute emissions | ||
| Percentage of reduction target achieved in absolute emissions | ||
| Percentage of reduction target from base year in emissions intensity | ||
| Percentage of reduction target achieved in absolute emissions intensity | ||
| 1.4. | Coal and Oil & Gas Exit policy. Phase-out date, exclusion scope. | |
| Deforestation financing exclusion policy. Phase-out date, exclusion scope | ||
| Portfolio coverage target year, Scope/Portfolio coverage target on transition plan. | ||
| 1.5. | Climate financing roadmap/framework | |
| 3 - Intangible investment | 3.1 | Total number of employees, Number of employees receiving climate-related trainings, Total costs of employees’ trainings, costs of climate-related trainings. |
| Pedagogical/climate training capabilities roadmap. | ||
| 3.2 | R&D Budget and budget dedicated to climate topics | |
| 4 - Portfolio Climate Performance | 4.1 |
Use of Proceeds amounts. Taxonomic activities financed. Breakdown by sector and asset class. General Corporate Purpose amounts. Financed Companies with a credible and robust transition plan. |
| 4.2 | Portfolio alignment exercise outputs | |
| 4.3 |
Use of Proceeds amounts. Taxonomic activities advised. Breakdown by sector and asset class. General Corporate Purpose amounts. Advised companies with a credible and robust transition plan. |
|
| 5 - Management | 5.1 | Environmental policy and details regarding governance |
| 5.2 | Environmental policy and details regarding governance | |
| 5.3 | Environmental policy and details regarding governance | |
| 5.4 | Management incentives | |
| 5.5 | Climate risk management framework/strategy | |
| 5.6 | Scenario testing | |
| 6 - Savers engagement | 6.1 | Engagement strategy and measures of success |
| 6.2 |
Actions implemented to influence savers to reduce their GHG emissions Size and Number of savers engaged |
|
| 7 - Clients engagement | 7.1 | Engagement strategy to influence clients GHG emissions |
| Impact Management framework | ||
| Fossil Fuel & Deforestation engagement strategy | ||
| 7.2 | Strategy to influence clients GHG emissions | |
| Size and number of clients engaged | ||
| 7.3 | Fossil Fuel & Deforestation engagement actions implemented | |
| 8- Policy engagement | 8.1 | Public climate change policy positions |
| Description of this policy (scope & boundaries, responsibilities, process to monitor and review) | ||
| Trade associations that are likely to take a position on climate change legislation | ||
| 8.2 | Company policy on engagement with associations, alliances, coalitions or thinktanks | |
| 8.3 | Position of the company on significant climate policies (public statements, etc.). | |
| 8.4 | Public climate change policy positions | |
| Description of this policy (scope & boundaries, responsibilities, process to monitor and review) | ||
| 9 - Business Model | 9.1 | Description of the tools and policies implemented to change the structural financing approach and other ways of appraising economic value. |
| Size of implementation. Deployment schedule. Growth potential. Profitability. | ||
| 9.2 | Amount of Low carbon share of financings | |
| Profitability of business model | ||
| Size of business model | ||
| Growth potential of business model | ||
| Deployment schedule of business model |
7 Rating
The ACT rating shall comprise:
- A performance score
- A narrative score
- A trend score
These pieces of information shall be represented within the ACT rating as follows:
- Performance score as a number from 1 (lowest) to 20 (highest)
- Narrative score as a letter from E (lowest) to A (highest)
- Trend score as either “+” for improving, “-” for worsening, or “=” for stable.
In some situations, trend scoring may reveal itself to be unfeasible depending on data availability. In this case, it should be replaced with a “?”.
The highest rating is thus represented as “20A+”, the lowest as “1E-” and the midpoint as “10C=”.
Table 6: highest score for each ACT score type
|
The highest available ACT rating is 20 A + |
A performance rating of 20: the financial institution received high scores in its assessment against the methodology indicators. |
| An assessment rating of A: the information reported by the financial institution and available from public sources was consistent and showed that the financial institution is well aligned to contribute to financing a low-carbon economy | |
| A trend rating of +: the information provided shows the financial institution will be better placed to contribute the financing a low-carbon economy in future. |
Each financial institution assessed using an ACT methodology received not only an ACT rating but a commentary on their performance across the three aspects of the rating. This gave a nuanced picture of the financial institution’s strengths and weaknesses. Detailed information on the ACT rating is available in the ACT Framework document.
7.1 Performance scoring
Performance scoring shall be performed in compliance with the ACT Framework.
7.2 Narrative scoring
The narrative scoring shall be performed in compliance with the ACT Framework, assessing the financial institution on the 4 following criteria:
- Business model and strategy
- Consistency and credibility
- Reputation
- Risk
The information reported in module 1, 4, 7 and module 9 shall be considered with peculiar attention for the narrative analysis and narrative scoring.
The information reported in Module 1 and 4 shall be considered with peculiar attention for the narrative analysis and narrative scoring: with this information, the analyst can have a holistic view on the financial institution’s actions to transition and contribute to a low carbon economy and to what extent financings are integrated in financial institution’s climate strategy. In module 1 and 4, critical information on strategy and actions related to fossil fuels phase out is captured which a key element of credibility regarding climate strategy. A financial institution with a bad score in the strategy and actions regarding fossil fuels financing shall not have a good narrative scoring.
The analyst shall also pay attention to indicator 7.1 and engagement actions in the 7.2 and 7.3 by the financial institution with its clients as it is the most impactful lever and where the challenges of the sector lay. Key information on engagement with fossil fuels companies/projects have also been integrated in the indicator 7.2 and shall be considered in conducting the narrative assessment.
Indicators from other modules provide valuable information to assess the consistency of actions taken with respect to GHG based targets, management, and engagement with other stakeholders. No other sector-specific issue impacting the narrative scoring for this sector has been identified to date
The information reported in indicator 9.1 regarding efforts (tools & policies) deployed by a financial institution to foster channelling credits to a low carbon economy is to be particularly considered.
| Module | Indicator |
|---|---|
| 1. Targets | LEN 1.4 Engagement Targets |
| LEN 1.5 Financing Targets | |
| 4. Portfolio climate performance | LEN 4.1 Financial Flows Trend |
| LEN 4.2 Portfolio alignment exercise | |
| 7. Clients engagement | LEN 7.2 Activities to influence clients to reduce their GHG emissions |
| LEN 7.3 Tools/policy facilitating channelling credits to the transition towards a low carbon economy | |
| 9. Business Model | LEN 9.1. Tools/policy facilitating channelling credits to the transition towards a low carbon economy |
7.3 Trend scoring
Scoring shall be performed in compliance with the ACT Framework.
To apply the trend scoring methodology presented in the ACT Framework, the analyst should identify the trends from the existing data infrastructure based on the data points and/or indicators that can indicate the future direction of change within the company.
The table below includes an overview of which indicators/data points could possibly have valuable information about future directions.
| Module | Indicator |
|---|---|
| Targets | LEN 1.1 Alignment of emission reduction target |
| LEN 1.2 Time horizon of targets | |
| LEN 1.4 Engagement targets | |
| LEN 1.5 Financing targets | |
| Portfolio Climate Performance | LEN 4.1 Financial Flows Trend |
| Management | LEN 5.3 Low-carbon transition plan |
| LEN 5.6 Climate change scenario testing | |
| Savers | LEN. 6.1 Strategy to influence suppliers to reduce their GHG emissions |
| Clients | LEN. 7.1 Strategy to influence customer behaviour to reduce their GHG emissions |
| Policy engagement | LEN 8.4 Collaboration with local public authorities |
| Business model | LEN 9.1. Tools/policy facilitating channelling credits to the transition towards a low carbon economy |
| LEN 9.2. Financial flows reorientation towards (i) aligned or (ii) transitional entities or (III) climate change solutions |
8 Aligned state
The table below presents the response of a low-carbon aligned company of the sector to the 5 questions of ACT:
- What is the financial institution planning to do? [Commitment]
- How is the financial institution planning to get there? [Transition Plan]
- What is the financial institution financing at present? [Present]
- What has the financial institution financed in the recent past? [Legacy]
- How do all of these plans and actions fit together? [Consistency]
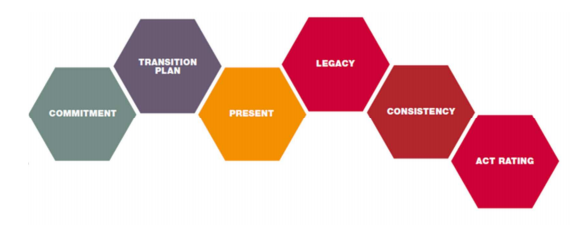
| 1 | 2 | 3 | 4 | 5 |
| The financial institution has set emissions reduction targets on the most effective sectors financed. These objectives are aligned with a relevant time horizon. More, these targets have been complemented with non GHG based emissions targets, and notably on fossil fuel exit, in order to look for impact i.e. direct GHG emissions and not only at portfolio level. | The financial institution understands its financed emissions are the main source of emissions. Therefore, the financial institution discloses a transition plan that details strategy & operation steps to achieve their objectives. | Current strategies and actions aim at reducing emissions in the real economy and leverage its market position to drive change across the value chain from upstream to downstream activities. | Clear evidence of reducing financed emissions, and a strong track record of successful engagement actions with counterparties that highlights the financial institution’s ability and will to enact change beyond its direct emissions. | The financial institution’s targets, transition plan, present and past actions show a consistent willingness to look for impact and contribute to the goals. |
Figure 3: Aligned state for companies
9 Sources
1. 2DII. https://2degrees-investing.org/wp-content/uploads/2021/04/Climate-Impact-Mgmt-System.pdf.
2. Julian F. Kölbel, Florian Heeb, Falko Paetzold and Timo Busch. Can Sustainable Investing Save the World?
3. Eurostat. https://ec.europa.eu/eurostat/documents/3859598/5902521/KS-RA-07-015-EN.PDF.
4. Guidance, GHG Protocol - GHG Protocol Financial Sector. https://ghgprotocol.org/sites/default/files/standards_supporting/GHG%20Protocol%20Financial%20Sector%20Guidance%20Survey%20Results%20Report%20-%20Final.pdf. [Online]
5. Protocol, GHG. https://ghgprotocol.org/sites/default/files/standards_supporting/New%20York%20Scoping%20Workshop%20Summary%20-%20GHG%20Protocol%20Financial%20Sector%20Guidance.pdf. [Online]
6. PCAF. https://carbonaccountingfinancials.com/files/downloads/pcaf-capital-market-instruments-proposed-methodology-2022.pdf.
7. CDP. https://www.cdp.net/en/articles/media/finance-sectors-funded-emissions-over-700-times-greater-than-its-own. [Online]
8. FI, UNEP. NZAOA Target Setting Protocol Second Edition.
9. SBTi. https://sciencebasedtargets.org/resources/files/Sectoral-Decarbonization-Approach-Report.pdf.
10. SBTI. p.60, Table 5.3. Sector and Asset Class Coverage of Sectoral Decarbonization Approach and Available Temperature Rating and Target Setting Resources, https://sciencebasedtargets.org/resources/files/Financial-Sector-Science-Based-Targets-Guidance.pdf.
11. NZBA. https://www.unepfi.org/wordpress/wp-content/uploads/2021/04/UNEP-FI-Guidelines-for-Climate-Change-Target-Setting.pdf.
12. 2DII. For instance, refer to p.32, https://2degrees-investing.org/wp-content/uploads/2020/02/2DII-Targets-Impact.pdf.
13. Ourwolrdindata. https://ourworldindata.org/emissions-by-sector; https://ourworldindata.org/emissions-by-fuel.
14. PCAF. (https://carbonaccountingfinancials.com/standard#the-global-ghg-accounting-and-reporting-standard-for-the-financial-industry.
15. —. https://carbonaccountingfinancials.com/files/consultation-2021/pcaf-capital-market-instruments-paper.pdf.
16. Action, Share. https://api.shareaction.org/resources/reports/ShareAction_Banking_Survey_2022-final.pdf.
17. initiative, ACT. https://actinitiative.org/wp-content/uploads/pdf/act_agriculture_agrifood_methodology_draft.pdf.
18. IIGCC. https://www.iigcc.org/media/2022/04/JC0426_IIGCC_Climate-Transition-Report_FINAL.pdf. [Online]
19. Company, Mc Kinsey &. https://www.mckinsey.com/industries/financial-services/our-insights/managing-financed-emissions-how-banks-can-support-the-net-zero-transition?cid=soc-web. [Online]
20. Alliance, World Benchmarking. https://www.worldbenchmarkingalliance.org/climate-and-energy-benchmark/.
21. 100+, Climate Action. https://www.climateaction100.org/net-zero-company-benchmark/.
22. initiative, ACT. https://actinitiative.org/act-methodologies/. [Online]
23. GFANZ. https://assets.bbhub.io/company/sites/63/2022/09/Measuring-Portfolio-Alignment-Enhancement-Convergence-and-Adoption-November-2022.pdf. [Online]
24. Willis Towers Watson. Executive Compensation Guidebook for Climate Transition. 2021.
25. Breaking the tragedy of the horizon – climate change and financial stability – speech by Mark Carney. Speech given at Lloyd’s of London. https://www.bankofengland.co.uk/speech/2015/breaking-the-tragedy-of-the-horizon-climate-change-and-financial-stability. [Online]
26. https://www.bankingsupervision.europa.eu/ecb/pub/pdf/ssm.thematicreviewcerreport112022~2eb322a79c.en.pdf. [Online]
27. https://www.bankingsupervision.europa.eu/ecb/pub/pdf/ssm.climateriskstresstest2021~a4de107198.en.pdf. [Online]
28. https://acpr.banque-france.fr/sites/default/files/medias/documents/20200525_synthese_gouvernance_anglais.pdf. [Online]
29. TCFD. TCFD Recommendations Technical Supplement: The Use of Scenario Analysis in Disclosure of Climate-related Risks and Opportunities. 2017.
30. IEA. World Energy Outlook 2019. 2019.
31. Bank, European Central. https://www.bankingsupervision.europa.eu/press/pr/date/2022/html/ssm.pr220708~565c38d18a.en.html.
32. Group, Oxford Sustainable Finance. https://www.smithschool.ox.ac.uk/sites/default/files/2022-04/Sustainable-Finance-and-Transmission-Mechanisms-to-the-Real-Economy.pdf. [Online]
33. CDP. 2022 CDP climate change questionnaire. CDP. [Online] 2022. [Cited: 5 July 2022.] https://www.cdp.net/en/guidance/guidance-for-companies.
34. SBTi. Value Change in the Value Chain: Best practices in scope 3 greenhouse gas management. 2017.
35. 2DII. https://2degrees-investing.org/wp-content/uploads/2022/06/1in1000_PCAF_Disclosures_v1.pdf. [Online]
36. Responsible climate lobbying. Appendix: The 14 indicators of responsible climate lobbying. 2022.
37. AAA Framework for Climate Policy Leadership. Align. AAA Framework for Climate Policy Leadership. [Online] [Cited: 5 July 2022.] https://www.aaaclimateleadership.org/align/.
38. InfluenceMap. InfluenceMap. [Online] [Cited: 5 July 2022.] https://influencemap.org/.
39. [Online], Climate Dividends. https://www.climate-dividends.com/.
40. I4CE, Julie Evain -. https://www.i4ce.org/en/publication/implementing-prudential-transition-plans-banks-what-are-expexted-impacts-climate/. [Online]
41. Carney, Breaking the tragedy of the horizon - climate change and financial stability - speech by Mark. https://www.bankofengland.co.uk/speech/2015/breaking-the-tragedy-of-the-horizon-climate-change-and-financial-stability. [Online]
42. SBTi. https://sciencebasedtargets.org/resources/files/Financial-Sector-Science-Based-Targets-Guidance.pdf. [Online]
43. FI, UNEP. https://www.unepfi.org/wordpress/wp-content/uploads/2022/05/UTS_Limit-global-warming_Sectoral-Pathways-and-Key-KPIs.pdf. [Online]
44. SBTi. https://sciencebasedtargets.org/resources/files/Financial-Sector-Science-Based-Targets-Guidance.pdf. [Online]
45. Commission, European. Commission delegated regulation (EU) 2021/2139 of 4 June 2021, supplementing Regulation (EU) 2020/852 of the European Parliament and of the Council by. 2021.
46. Initiative, Climate Bond. Climate Bond taxonomy. 2021.
47. CDP. Climate Transition Plan: Discussion Paper. London, UK : s.n., 12 November 2021.
48. Yemm, Graham. FT Essential Guide to Leading Your Team. Harlow : Pearson, 2012.
49. SME Climate Hub. 1.5°C Supplier Engagement Guide. SME Climate Hub. [Online] [Cited: 5 July 2022.] https://smeclimatehub.org/supply-chain-leaders/supplier-engagement-guide/.
50. C3D. Les achats au cœur de la stratégie climat. 2022.
51. roadmap, IIGCC - Climate Investment. https://www.iigcc.org/media/2022/04/JC0426_IIGCC_Climate-Transition-Report_FINAL.pdf. [Online]
52. FI, UNEP. https://www.unepfi.org/wordpress/wp-content/uploads/2022/05/UTS_Limit-global-warming_Sectoral-Pathways-and-Key-KPIs.pdf. [Online]
53. THE, CDP - CDP SIGNPOSTING & FEEDBACK OPPORTUNITY: 2022 CDP QUESTIONNAIRE FOR. https://cdn.cdp.net/cdp-production/comfy/cms/files/files/000/005/215/original/CDP_2022_Financial_Services_Signposting_Briefing_Document_-_Clean.pdf.
54. zero, IIGCC and TPI - An investor-led framework of pilot indicators to assess banks on the transition to net. https://www.iigcc.org/news/iigcc-and-tpi-publish-investor-led-framework-of-pilot-indicators-to-assess-banks-on-the-transition-to-net-zero/.
55. quo, Reclaim Finance - Engagement actionnarial : les investisseurs au service du statu. https://reclaimfinance.org/site/wp-content/uploads/2022/02/2202_RF_Rapport-engagement_Vfinale.pdf.
56. Tool, Reclaim Finance - Coal Policy. https://coalpolicytool.org/.
57. Tracker, Reclaim Finance - Oil&Gas Policy. https://oilgaspolicytracker.org/.
58. Urgewald. https://gogel.org/.
59. List, Urgewald - Global Coal Exit. https://www.coalexit.org/.
60. Methodology, WBA - Financial System Benchmark. https://assets.worldbenchmarkingalliance.org/app/uploads/2021/12/WBA21_financial-system-benchmark_v4.pdf.
61. 2020, Banque de France - Assessment of risks to the French financial system - June. https://publications.banque-france.fr/en/assessment-risks-french-financial-system-june-2020.
62. test, European Central Bank - Climate risk stress. https://www.bankingsupervision.europa.eu/ecb/pub/pdf/ssm.climateriskstresstest2021~a4de107198.en.pdf.
63. management, European Central Bank - Good practices for climate-related and environmental risk. https://www.bankingsupervision.europa.eu/ecb/pub/pdf/ssm.thematicreviewcercompendiumgoodpractices112022~b474fb8ed0.en.pdf?8330f3208649c4b24d2a6f4204447f9f.
64. change, ISO - 14097 - Greenhouse gas management and related activities — Framework including principles and requirements for assessing and reporting investments and financing activities related to climate. https://www.iso.org/standard/72433.html.
65. lending, UNEP FI - Practical Approaches to applying the Eu taxonomy to bank. https://www.unepfi.org/wordpress/wp-content/uploads/2022/02/Practical-Approaches-to-Applying-the-EU-Taxonomy-to-Bank-Lending-2022.pdf.
66. taxonomies, Bank for International settlements - A taxonomy of Sustainable finance. https://www.bis.org/publ/bppdf/bispap118.pdf.
67. Framework, ADEME - Climate Transparency Hub. https://climate-transparency-hub.ademe.fr/dossier/.
68. cookbook, Institut Louis Bachelier - the alignement. https://www.institutlouisbachelier.org/wp-content/uploads/2021/03/the-alignment-cookbook-a-technical-review-of-methodologies-assessing-a-portfolios-alignment-with-low-carbon-trajectories-or-temperature-goal.pdf.
69. PCAF. https://2degrees-investing.org/wp-content/uploads/2022/06/1in1000_PCAF_Disclosures_v1.pdf. [Online]
70. initiative, ACT. https://actinitiative.org/wp-content/uploads/pdf/act-framework-eng-2019-04-09.pdf. [Online]
71. Kinsey, Mc. https://www.mckinsey.com/industries/financial-services/our-insights/managing-financed-emissions-how-banks-can-support-the-net-zero-transition?cid=soc-web. [Online]
10 Glossary
| 2 degrees (2°C) | A political agreement was reached at COP21 on limiting global warming to 2°C above the pre-industrial level (COP21: Why 2°C?). A 2°C scenario (or 2°C pathway) is a scenario (or pathway) compatible with limiting global warming to 2°C above the pre-industrial level. | |
| ACA | Absolute Contraction Approach. ‘The absolute contraction approach is a method for companies to set emissions reduction targets that are aligned with the global, annual emissions reduction rate that is required to meet 1.5˚C or WB2˚C.’ See Foundations of Science-based Target Setting from SBTi (2019) | |
| ACT | The Assessing low-Carbon Transition (ACT) initiative was jointly developed by ADEME and CDP. ACT assesses how ready an organization is to transition to a low-carbon world using a future-oriented, sector-specific methodology (ACT website). | |
| Action gap | In relation to emissions performance and reduction, the action gap is the difference between what a given company has done in the past plus what it is doing now, and what has to be done. For example, companies with large action gaps have done relatively little in the past, and their current actions point to continuation of past practices. | |
| Activity data | Activity data are defined as data on the magnitude of human activity resulting in emissions or removals taking place during a given period of time (UNFCCC definitions). | |
| ADEME | Agence de la Transition Ecologique; The French Agency for Ecological Transition (ADEME webpage). | |
| Advanced vehicle |
Advanced vehicles include: Plug-in hybrid vehicles (PHEV) Battery electric vehicles (BEV) Fuel cell electric vehicles (FCEV) Conventional hybrids Other high-efficiency ICE vehicles Conventional hybrids and other high-efficiency ICE vehicles are advanced vehicles but they are not low-carbon vehicles. |
|
| Alignment | The ACT project seeks to gather information that will be consolidated into a rating that is intended to provide a general metric of the 2-degree alignment of a given company. The wider goal is to provide companies specific feedback on their general alignment with 2-degrees in the short and long term. | |
| Analyst | Person in charge of the ACT assessment. | |
| Assess | Under the ACT project, to evaluate and determine the low-carbon alignment of a given company. The ACT assessment and rating will be based on consideration of a range of indicators. Indicators may be reported directly from companies. Indicators may also be calculated, modelled or otherwise derived from different data sources supplied by the company. The ACT project will measure 3 gaps (Commitment, Horizon and Action gaps – defined in this glossary) in the GHG emissions performance of companies. This model closely follows the assessment framework presented above. It starts with the future, with the goals companies want to achieve, followed by their plans, current actions and past actions. | |
| Asset | An item of property owned by a company, regarded as having value and available to meet debts, commitments, or legacies. Tangible assets include 1) fixed assets, such as machinery and buildings, and 2) current assets, such as inventory. Intangible assets are nonphysical such as patents, trademarks, copyrights, goodwill and brand value. | |
| Asset class | A group of financial instruments having similar financial characteristics. (44) | |
| Barrier | A circumstance or obstacle preventing progress (e.g. lacking information on supplier emissions and hotspots can be a barrier to companies managing and reducing their upstream indirect emissions). | |
| Base year | According to the GHG Protocol and ISO14064-1, a base year is “a historic datum (a specific year or an average over multiple years) against which a company’s emissions are tracked over time”. Setting a base year is an essential GHG accounting step that a company must take to be able to observe trends in its emissions information (GHG Protocol Corporate Standard). | |
| Benchmark | A standard, pathway or point of reference against which things may be compared. In the case of pathways for sector methodologies, a sector benchmark is a low-carbon pathway for the sector average value of the emissions intensity indicator(s) driving the sector performance. A company’s benchmark is a pathway for the company value of the same indicator(s) that starts at the company performance for the reporting year and converges towards the sector benchmark in 2050, based on a principle of convergence or contraction of emissions intensity. | |
| Board | Also the “Board of Directors” or “Executive Board”; the group of persons appointed with joint responsibility for directing and overseeing the affairs of a company. | |
| Business model | A plan for the successful operation of a business, identifying sources of revenue, the intended client base, products, and details of financing. Under ACT, evidence of the business model shall be taken from a range of specific financial metrics relevant to the sector and a conclusion made on its alignment with low-carbon transition and consistency with the other performance indicators reported. | |
| Business-as-usual | No proactive action taken for change. In the context of the ACT methodology, the business-as-usual pathway is constant from the initial year onwards. In general, the initial year – which is the first year of the pathway/series – is the reporting year (targets indicators) or the reporting year minus 5 years (performance indicators). | |
| Capacity (power) | In relation to power generation, nameplate capacity is the power output number, usually expressed in megawatts (MW), and registered with authorities for classifying the power output of a power station. | |
| Capital expenditure | Money spent by a business or organization on acquiring or maintaining fixed assets, such as land, buildings, and equipment. | |
| Carbon Capture and Storage (CCS) | The process of trapping carbon dioxide produced by burning fossil fuels or other chemical or biological process and storing it in such a way that it is unable to affect the atmosphere. | |
| Carbon offsets | Carbon offsets are avoidance of GHG emissions or GHG suppressions made by a company, sector or economy to compensate for emissions made elsewhere in the economy, where the marginal cost of decarbonization proves to be lower. | |
| CDP | Formerly the "Carbon Disclosure Project", CDP is an international, not-for-profit organization providing the only global system for companies and cities to measure, disclose, manage and share vital environmental information. CDP works with market forces, including 827 institutional investors with assets of over US$100 trillion, to motivate companies to disclose their impacts on the environment and natural resources and take action to reduce them. More than 5,500 companies worldwide disclosed environmental information through CDP in 2015. CDP now holds the largest collection globally of primary climate change, water and forest risk commodities information and puts these insights at the heart of strategic business, investment and policy decisions (CDP website). | |
| Climate change | A change in climate, attributed directly or indirectly to human activity, that alters the composition of the global atmosphere and that is, in addition to natural climate variability, observed over comparable time periods (UNFCCC). | |
| Commitment gap | In relation to emissions performance, the difference between what a company needs to do and what it says it will do. | |
| Company | A commercial business. | |
| Company pathway | A company’s past emissions intensity performance pathway up until the present. | |
| Company target pathway | The emissions intensity performance pathway that the company has committed to follow from the initial year on until a future year, for which it has set a performance target. | |
| Confidential information | Any non-public information pertaining to a company's business. | |
| Conservativeness | A principle of the ACT project; whenever the use of assumptions is required, the assumption shall err on the side of achieving 2-degrees maximum. | |
| Consistency | A principle of the ACT project; whenever time series data is used, it should be comparable over time. In addition to internal consistency of the indicators reported by the company, data reported against indicators shall be consistent with other information about the company and its business model and strategy found elsewhere. The analyst shall consider specific, pre-determined pairs of data points and check that these give a consistent measure of performance when measured together. | |
| Conventional (technology) | In relation to automobiles and emissions, conventional internal combustion engines (ICE) are those that generate motive power by burning fossil fuels, as opposed to advanced (low-carbon) vehicle engines such as battery electric vehicles or hydrogen fuel cells. | |
| COP21 | The 2015 United Nations Climate Change Conference, held in Paris, France from 30 November to 12 December 2015 (COP21 webpage). | |
| Credible and robust transition plan | A credible and robust transition plan is a transition plan which has been assessed again recognized methodologies following best standard recommendation (e.g. EFRAG) and have proven to get a good score according to the associated tool. A strong reference can be found through the World Benchmarking Alliance (WBA) Climate & Energy benchmarks using the ACT assessment methodology for companies on various emissive sectors (Transport, Retail, Oil & Gas, Electric Utilities, Buildings). | |
| Data | Facts and statistics collected together for reference and analysis (e.g. the data points requested from companies for assessment under the ACT project indicators). | |
| Decarbonization | A complete or near-complete reduction of greenhouse gas emissions over time (e.g. decarbonization in the electric utilities sector by an increased share of low-carbon power generation sources, as well as emissions mitigating technologies like Carbon Capture and Storage (CCS)). | |
| Emissions | The GHG Protocol defines direct GHG emissions as emissions from sources that are owned or controlled by the reporting entity, and indirect GHG emissions as emissions that are a consequence of the activities of the reporting entity, but occur at sources owned or controlled by another entity (GHG Protocol). | |
| Energy | Power derived from the utilization of physical or chemical resources, especially to provide light and heat or to work machines. | |
| Financed emissions | Emissions associated with the financing | |
| Fleet | A group of vehicles (e.g. all the automobiles manufactured by an automotive manufacturing company and currently in use by private individuals). | |
| Fossil fuel | A natural fuel such as coal, oil or gas, formed in the geological past from the remains of living organisms. | |
| Future | A period of time following the current moment; time regarded as still to come. | |
| General corporate purpose | When a financing has been directed towards a general corporate purpose instrument, it means that the purpose of the financings is not explicitly targeted for a specific purpose (on the opposite of Use of Proceeds instruments) | |
| Greenhouse gas (GHG) | Greenhouse gas (e.g. carbon dioxide (CO2), methane (CH4), nitrous oxide (N2O) and three groups of fluorinated gases (sulfur hexafluoride (SF6), hydrofluorocarbons (HFCs), and perfluorocarbons (PFCs)) which are the major anthropogenic GHGs and are regulated under the Kyoto Protocol. Nitrogen trifluoride (NF3) is now considered a potent contributor to climate change and is therefore mandated to be included in national inventories under the United Nations Framework Convention on Climate Change (UNFCCC). | |
| Guidance | Documentation defining standards or expectations that are part of a rule or requirement (e.g. CDP reporting guidance for companies). | |
| Horizon Gap | In relation to emissions performance, the difference between the average lifetime of a company’s production assets (particularly carbon intensive) and the time-horizon of its commitments. Companies with large asset-lives and small-time horizons do not look far enough into the future to properly consider a transition plan. | |
| Incentive | A thing, for example money, that motivates or encourages someone to do something (e.g. a monetary incentive for company board members to set emissions reduction targets). | |
| Indicator | An indicator is a quantitative or qualitative piece of information that, in the context of the ACT project, can provide insight on a company’s current and future ability to reduce its carbon intensity. | |
| Intensity (emissions) | The average emissions rate of a given pollutant from a given source relative to the intensity of a specific activity; for example, grams of carbon dioxide released per MWh of energy produced by a power plant. | |
| Intervention | Methods available to companies to influence and manage emissions in their value chain, both upstream and downstream, which are out of their direct control (e.g. a retail company may use consumer education as an intervention to influence consumer product choices in a way that reduces emissions from the use of sold products). | |
| Lifetime | The duration of a thing's existence or usefulness (e.g. a physical asset such as a power plant). | |
| Long-term | Occurring over or relating to a long period of time; under ACT this is taken to mean until the year 2050. The ACT project seeks to enable the evaluation of the long-term performance of a given company while simultaneously providing insights into short- and medium-term outcomes in alignment with the long-term. | |
| Low-carbon benchmark pathway | Benchmark pathway (See ‘Benchmark’) | |
| Low-carbon scenario (or pathway) | A low-carbon scenario (or pathway) is a 2°C scenario, a well-below 2°C scenario or a scenario with higher decarbonization ambition. | |
| Low-carbon solution | A low-carbon solution (e.g. energy, technology, process, product, service, etc.) is a solution whose development will contribute to the low-carbon transition. | |
| Low-carbon transition | The low-carbon transition is the transition of the economy according to a low-carbon scenario. | |
| low-carbon vehicle |
Vehicles described as low-carbon (LCV) are defined as vehicles that have a drivetrain that have the potential to operate on non-fossil energy sources for at least > 50% of their common use phase. This includes: Plug-in hybrid vehicles (PHEV) Battery electric vehicles (BEV) Fuel cell electric vehicles (FCEV) Conventional hybrids are excluded from the definition of low-carbon vehicles. Because conventional hybrids do not eschew fossil fuels (aside from the minor addition of biofuels into the fuel mix), they are not qualified for the definition of an LCV. |
|
| Manufacture | Making objects on a large-scale using machinery. | |
| Maturity matrix | A maturity matrix is essentially a “checklist”, the purpose of which is to evaluate how well advanced a particular process, program or technology is according to specific definitions. | |
| Maturity progression | An analysis tool used in the ACT project that allows both the maturity and development over time to be considered with regards to how effective or advanced a particular intervention is. | |
| Mitigation (emissions) | The action of reducing the severity of something (e.g. climate change mitigation through absolute GHG emissions reductions) | |
| Model | A program designed to simulate what might or what did happen in a situation (e.g. climate models are systems of differential equations based on the basic laws of physics, fluid motion, and chemistry that are applied through a 3-dimensional grid simulation of the planet Earth). | |
| Pathway (emissions) | A way of achieving a specified result; a course of action (e.g. an emissions reduction pathway). | |
| Performance | Measurement of outcomes and results. | |
| Plan | A detailed proposal for doing or achieving something. | |
| Point | A mark or unit of scoring awarded for success or performance. | |
| Power | Energy that is produced by mechanical, electrical, or other means and used to operate a device (e.g. electrical energy supplied to an area, building, etc.). | |
| Power generation | The process of generating electric power from other sources of primary energy. | |
| Primary energy | Primary energy is an energy form found in nature that has not been subjected to any conversion or transformation process. It is energy contained in raw fuels, and other forms of energy received as input to a system. Primary energy can be non-renewable or renewable. | |
| Progress ratio | An indicator of target progress, calculated by normalizing the target time percentage completeness by the target emissions or renewable energy percentage completeness. | |
| Relevant / Relevance | In relation to information, the most relevant information (core business and stakeholders) to assess low-carbon transition. | |
| Renewable energy | Energy from a source that is not depleted when used, such as wind or solar power. | |
| Reporting year | Year under consideration. | |
| Research and Development (R&D) | A general term for activities in connection with innovation; in industry; for example, this could be considered work directed towards the innovation, introduction, and improvement of products and processes. | |
| Scenario | The Fifth Assessment Report (AR5) of the Intergovernmental Panel on Climate Change (IPCC) presents the results of an extensive climate modelling effort to make predictions of changes in the global climate based on a range of development/emissions scenarios. Regulation on climate change-related issues may present opportunities for your organization if it is better suited than its competitors to meet those regulations, or more able to help others to do so. Possible scenarios would include a company whose products already meet anticipated standards designed to curb emissions, those whose products will enable its clients to meet mandatory requirements or those companies that provide services assisting others in meeting regulatory requirements. | |
| Scenario analysis | A process of analysing possible future events by considering alternative possible outcomes. | |
| Science-Based Target | To meet the challenges that climate change presents, the world’s leading climate scientists and governments agree that it is essential to limit the increase in the global average temperature at below 2°C. Companies making this commitment will be working toward this goal by agreeing to set an emissions reduction target that is aligned with climate science and meets the requirements of the Science-Based Targets Initiative. | |
|
Scope 1 emissions Direct GHG emissions and removals |
All direct GHG emissions (GHG Protocol Corporate Standard). Category 1 from ISO 14064-1:2018: Direct GHG emissions and removals occur from GHG sources or sinks inside organizational boundaries and that are owned or controlled by the [reporting] organization. Those sources can be stationary (e.g. heaters,electricity generators, industrial process) or mobile (e.g. vehicles). |
|
|
Scope 2 emissions Indirect GHG emissions from imported energy |
Indirect GHG emissions from consumption of purchased electricity, heat or steam (GHG Protocol Corporate Standard). Category 2 from ISO 14064-1:2018: GHG emissions due to the fuel combustion associated with the production of final energy and utilities, such as electricity, heat, steam, cooling and compressed air [imported by the reported company]. It excludes all upstream emissions (from cradle to power plant gate) associated with fuel, emissions due to the construction of the power plant, and emissions allocated to transport and distribution losses. |
|
|
Scope 3 emissions Indirect GHG emissions |
Other indirect emissions, such as the extraction and production of purchased materials and fuels, transport-related activities in vehicles not owned or controlled by the reporting entity, electricity-related activities (e.g. T&D losses) not covered in Scope 2, outsourced activities, waste disposal, etc. (GHG Protocol Corporate Standard). Scope 3 also encompass the emissions related to the use of sold-products. ISO 14064-1:2018: GHG emission that is a consequence of an organization’s operations and activities, but that arises from GHG sources that are not owned or controlled by the [reporting] organization. These emissions occur generally in the upstream and/or downstream chain. Category 3 : indirect GHG emissions from transportation Category 4: Indirect GHG emissions from products used by an organization Category 5: Indirect GHG emissions associated with the use of products from the organization Category 6: Indirect GHG emissions from other sources |
|
| Sector | A classification of companies with similar business activities, e.g. automotive manufacturers, power producers, retailers, etc. | |
| Sectoral Decarbonization Approach (SDA) | To help businesses set targets compatible with 2-degree climate change scenarios, the Sectoral Decarbonization Approach (SDA) was developed. The SDA takes a sector-level approach and employs scientific insight to determine the least-cost pathways of mitigation, and converges all companies in a sector towards a shared emissions target in 2050. | |
| Short-term | Occurring in or relating to a relatively short period of time in the future. | |
| Strategy | A plan of action designed to achieve a long-term or overall aim. In business, this is the means by which a company sets out to achieve its desired objectives; long-term business planning. | |
| Stress test | A test designed to assess how well a system functions when subjected to greater than normal amounts of stress or pressure (e.g. a financial stress test to see if an oil & gas company can withstand a low oil price). | |
| Supplier | A person or entity that is the source for goods or services (e.g. a company that provides engine components to an automotive manufacturing company). | |
| Target |
A quantifiable goal (e.g. to reduce GHG emissions). The following are examples of absolute targets: metric tonnes CO2e or % reduction from base year metric tonnes CO2e or % reduction in product use phase relative to base year metric tonnes CO2e or % reduction in supply chain relative to base year The following are examples of intensity targets: metric tonnes CO2e or % reduction per passenger. Kilometre (also per km; per nautical mile) relative to base year metric tonnes CO2e or % reduction per square foot relative to base metric tonnes CO2e or % reduction per MWh |
|
| Technology | The application of scientific knowledge for practical purposes, especially in industry (e.g. low-carbon power generation technologies such as wind and solar power, in the electric power generation sector). | |
| Trade association | Trade associations (sometimes also referred to as industry associations) are an association of people or companies in a particular business or trade, organized to promote their common interests. Their relevance in this context is that they present an “industry voice” to governments to influence their policy development. The majority of organizations are members of multiple trade associations, many of which take a position on climate change and actively engage with policymakers on the development of policy and legislation on behalf of their members. It is acknowledged that in many cases companies are passive members of trade associations and therefore do not actively take part in their work on climate change (CDP climate change guidance). | |
| Transition | The process or a period of changing from one state or condition to another (e.g. from an economic system and society largely dependent on fossil fuel-based energy, to one that depends only on low-carbon energy). | |
| Transport | To take or carry (people or goods) from one place to another by means of a vehicle, aircraft, or ship. | |
| Trend | A general direction in which something (e.g., GHG emissions) is developing or changing. | |
| Verifiable / Verifiability | To prove the truth of, as by evidence or testimony; confirm; substantiate. Under the ACT project, the data required for the assessment shall be verified or verifiable. | |
| Weighting | The allowance or adjustment made in order to take account of special circumstances or compensate for a distorting factor. | |
11 Appendix
11.1 TWG members
This ACT methodology has been developed with inputs and feedbacks of the Technical Working Group, which met 7 times over the course of the development phase.
| Organisation | representatives |
|---|---|
11.2 Financial institutions involved in the road-test
| Financial institutions |
|---|
| 1. TBC |
| 2. TBC |
| 3. TBC |
| 4. TBC |
| 5. TBC |
| 6. TBC |
| 7. TBC |
| 8. TBC |
| 9. TBC |
| 10. TBC |
11.3 Pedagogical graphs for 4.1’s trend ratio
Illustration of the different cases
Case 1
| Conditions | Score |
|---|---|
|
FI′s sectoral trend > 0 Increase in FI’s sectoral emissions intensity |
0% |
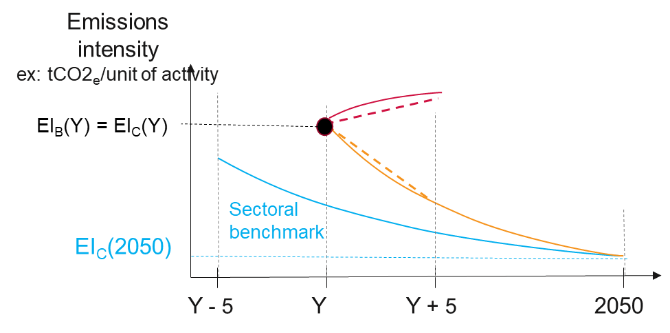
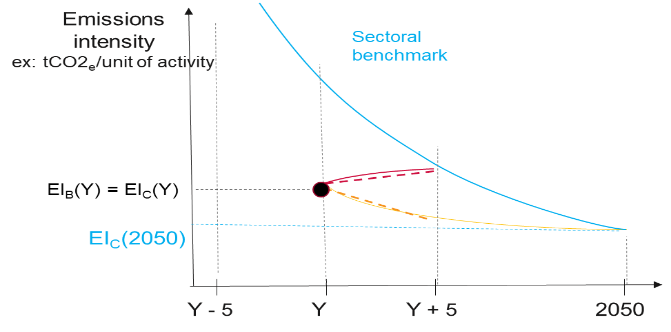
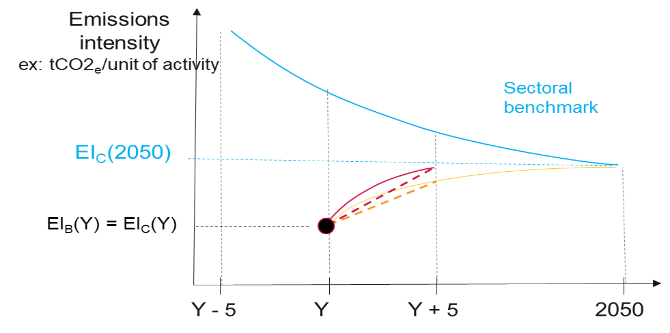

Figure 9: trend ratio - case 1
Case 2
| Conditions | Score |
|---|---|
|
FI′s sectoral trend ≤ 0 and EIC(YR) ≥ EIB(2050) 0 ≤ trend ratio ≤ 1 Decrease in FI’s sectoral emissions intensity but its pathway does not go beyond the sectoral benchmark ambition |
Trend ratio × 100% |
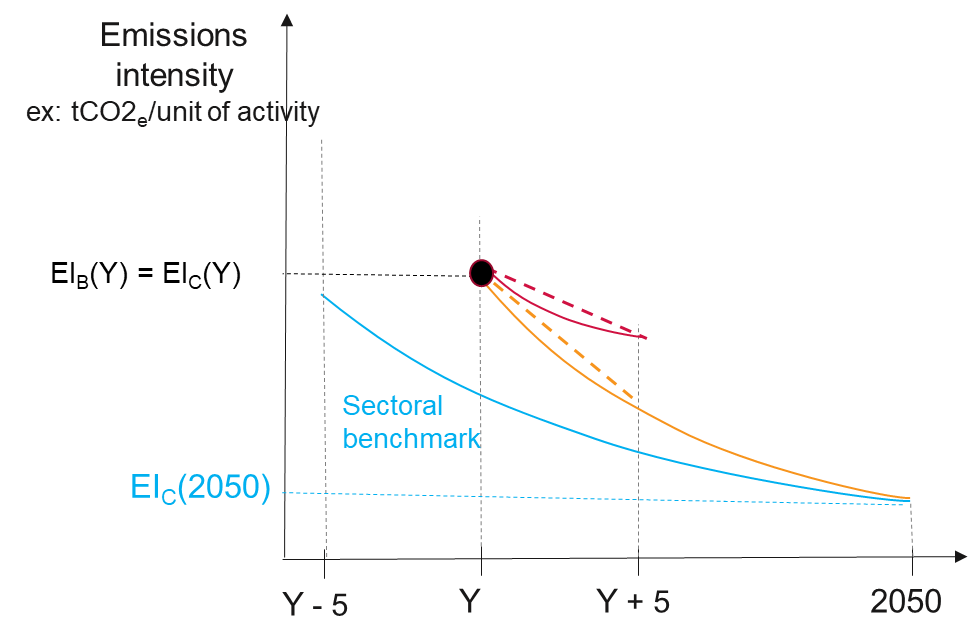
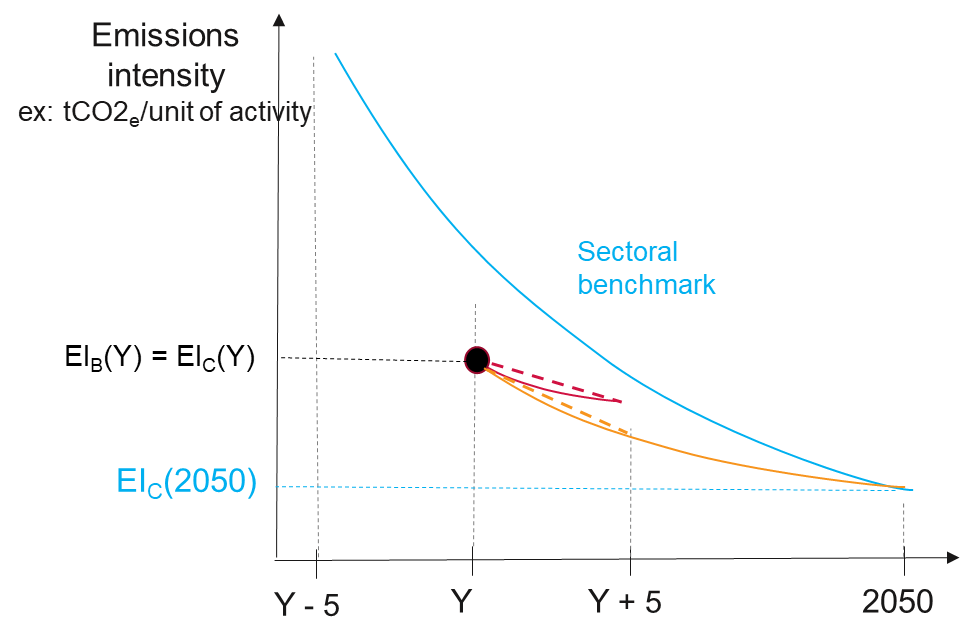

Figure 10: trend Ratio - case 2
Case 3
| Conditions | Score |
|---|---|
|
FI′s sectoral trend < 0 trend ratio > 1 Decrease in FI’s sectoral emissions intensity and its pathway equals or exceeds the sectoral benchmark ambition |
100% |
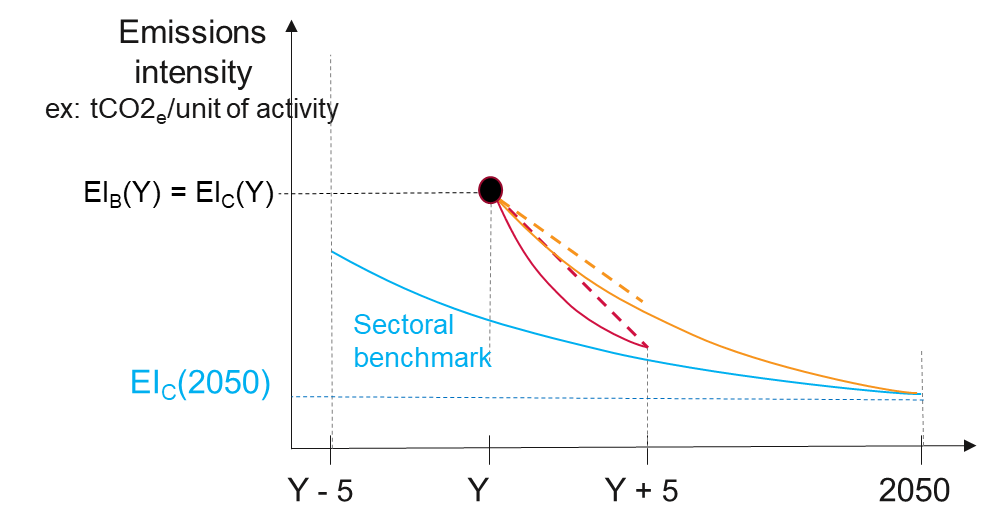
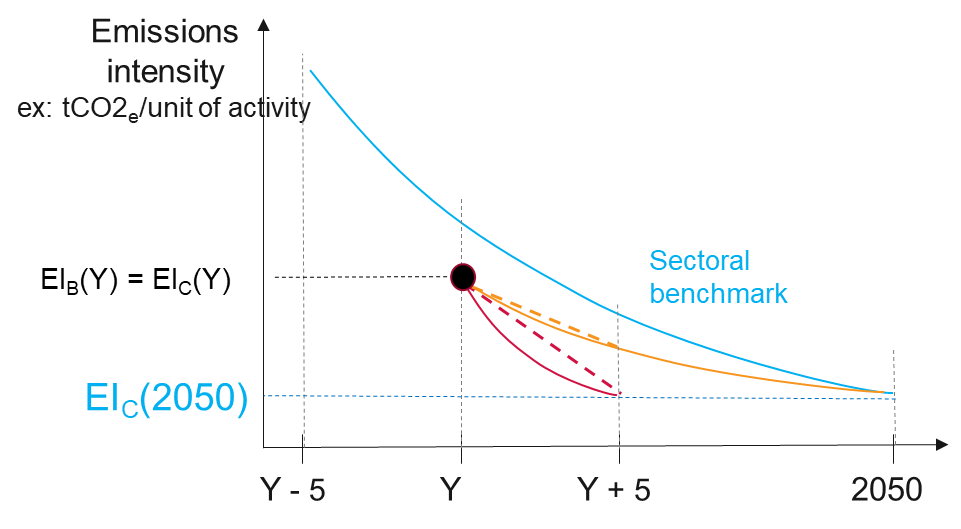

Figure 11: trend Ratio - case 3
Case 4
| Conditions | Score |
|---|---|
|
FI′s sectoral trend ≤ 0 and EIC(YR) ≤ EIB(2050) No increase in FI’s sectoral emissions intensity and its emissions intensity is already below the sectoral benchmark ambition for 2050 |
100% |
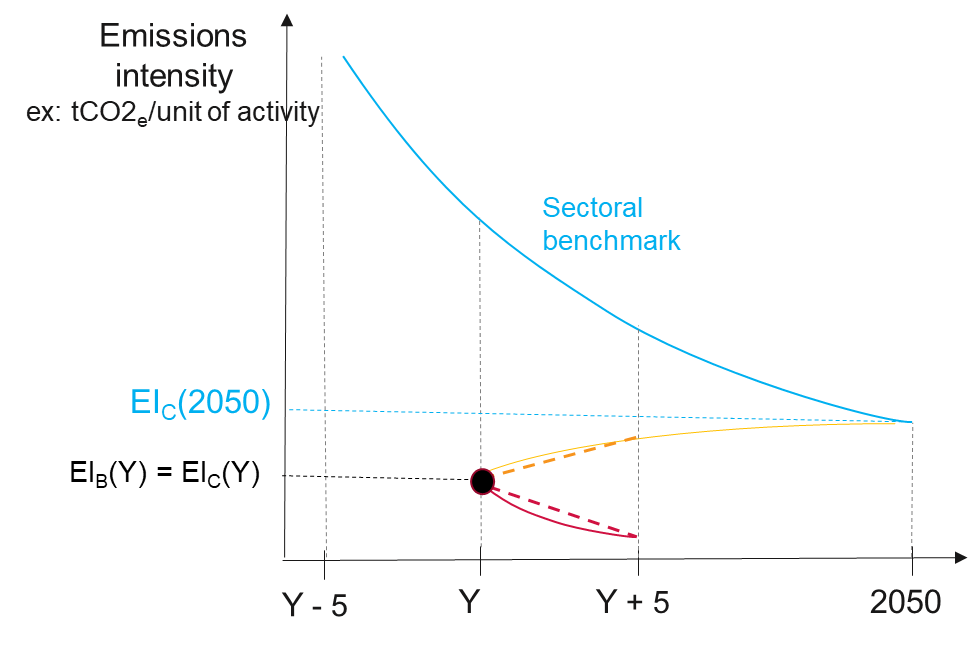
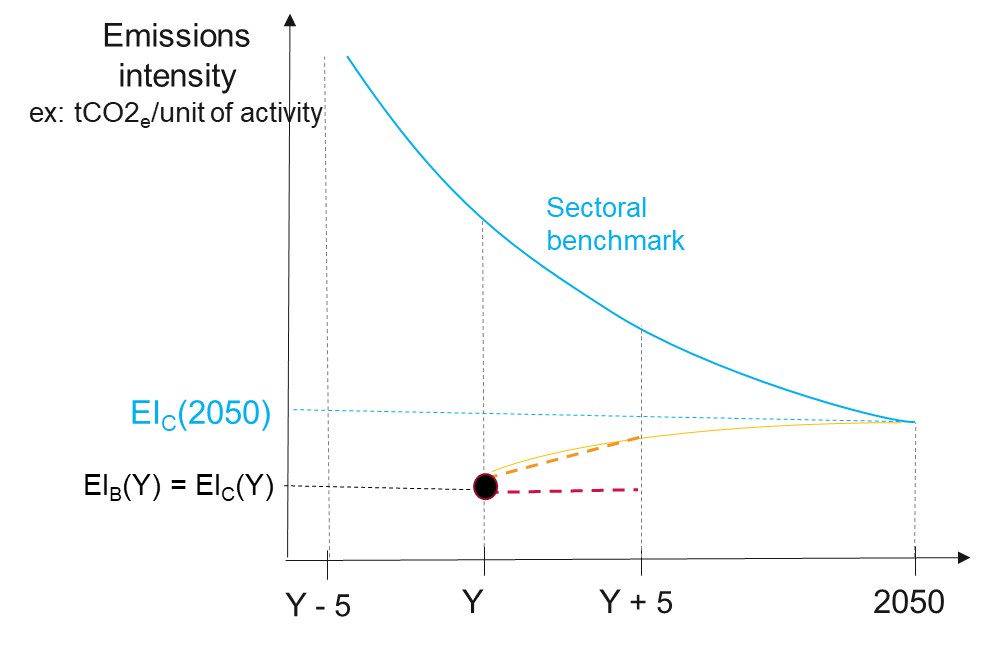

Figure 12: trend Ratio - case 4
ACT 4 Finance Mapping with other initiatives
I Care environnement has been chosen to conduct this analysis which should be integrated in this document by September 2023.